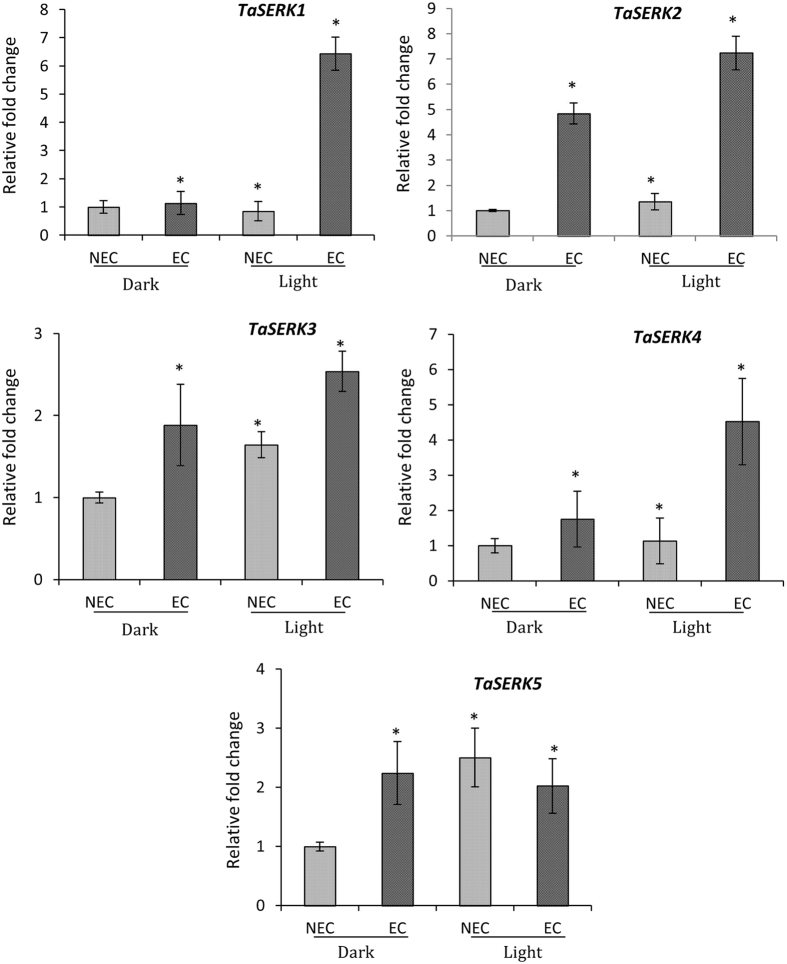
Figure 3.
Expression analysis of TaSERK1, 2, 3, 4 and 5 in wheat embryogenic and non-embryogenic callus. cDNAs normalized to housekeeping gene, ACTIN, in different tissues grown under dark and light culture conditions, respectively. The error bars represent mean ± SD of two biological replicates, each analysed with three technical replicates. Asterisks above the bars represent the significance levels (Students t-test; *p value ≤ 0.05).

