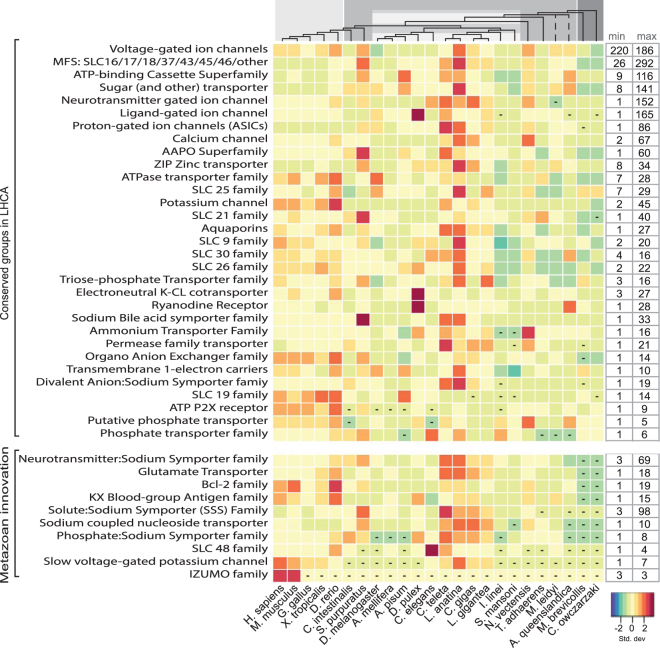
Figure 4.
Transporters: the evolution of selected transportation families in eukaryotes. The heatmap presents the relative content of selected transporter families across different metazoan species. For each organism, the number of transporters in a specific family was standardized with the standard deviation for that family. The key indicates that an increasing darker red hue illustrates more transporters coded as the number of standard deviations from zero (the mean) and an increasing blue colour corresponds with less transporter proteins coded. The boxes with dashes indicate no members in that group. The transporter family names are specified on the left side left and functional clusters are grouped according to those identified in the LHCA subset and those clusters that are metazoan innovation. The minimum and maximum values for the selected transporter families are displayed on the right side of the heatmap so that the relative colour differentiation is clarified by the range of proteins present in each transporter family. The dendrogram at the top of the heatmap represents the evolutionary relationship among the investigated organisms. The branch lengths are not relative to evolutionary distance. The dashed lines indicate unresolved lineages. Species topology including I. linei is based on ref.60 and the A. queenslandica placement is from ref.61. The light gray colour corresponds to vertebrate metazoans, the darker gray represents invertebrate species, the striped gray box is protostomia members, and the dark gray are the two opisthokont unicellular relatives.

