
Figure 2.
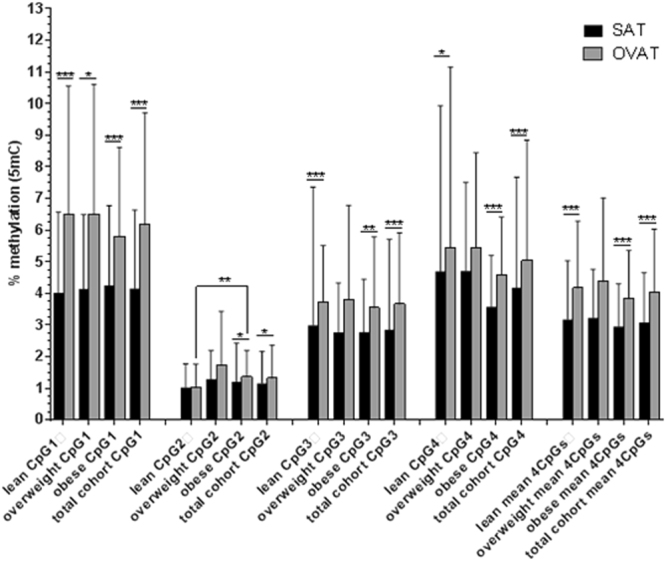
DNA methylation at one CpG locus within IRS1 promoter in SAT vs OVAT in BMI subgroups. Data are presented as mean ± standard deviation (S.D.). Number of participants: lean = 50; overweight = 28; obese = 68; total cohort = 146. P-values were calculated using non-parametric tests; significance of p-values are indicated as following *<0.05; **<0.001; ***<0.0001. 5mC = 5methyl cytosine; SAT = subcutaneous adipose tissue; OVAT = omental visceral adipose tissue.