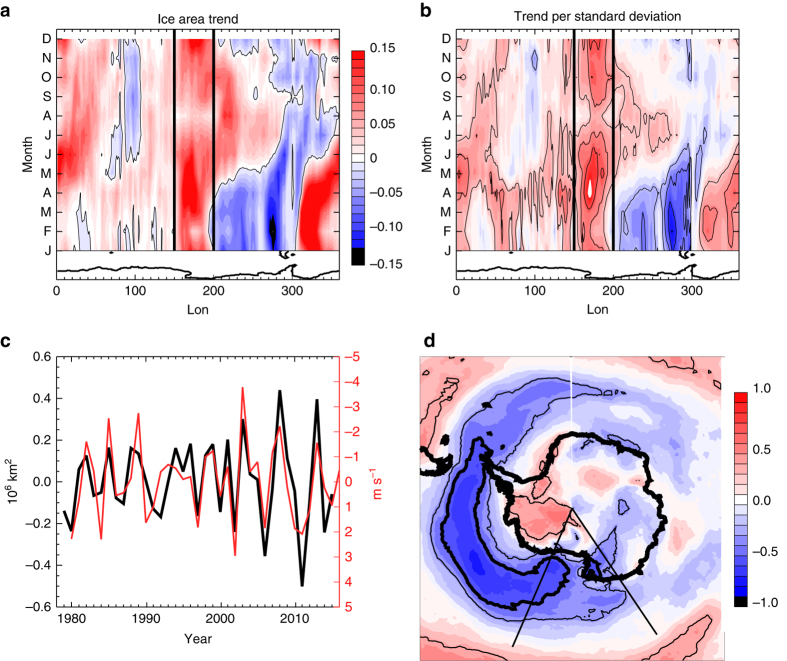
Fig. 1.
Observed sea ice properties and relationship to October zonal winds. a Sea ice area trend in 106 km2 per 37 years, from 1979 to 2015 as a function of longitude (at every 1.125o) and month. b Sea ice area trend relative to the interannual standard deviation as a function of longitude and month. The lined contour interval is 1 standard deviation. The zero contour is omitted. c The timeseries of March sea ice area anomalies in the 150–200º E region (black; left axis) and the averaged preceding October zonal wind anomaly index (red; right axis). The two timeseries have been detrended. d The correlation of the preceding gridded October zonal wind anomalies with the March western Ross Sea ice area. The thin lined contour indicates the 95% significance level. The zonal wind index timeseries shown in c is the average over the region of high negative correlation (R < −0.5) that is indicated by the bold black contour on d. The 150–200º E region is indicated on d by the thin black lines

