
Fig. 6.
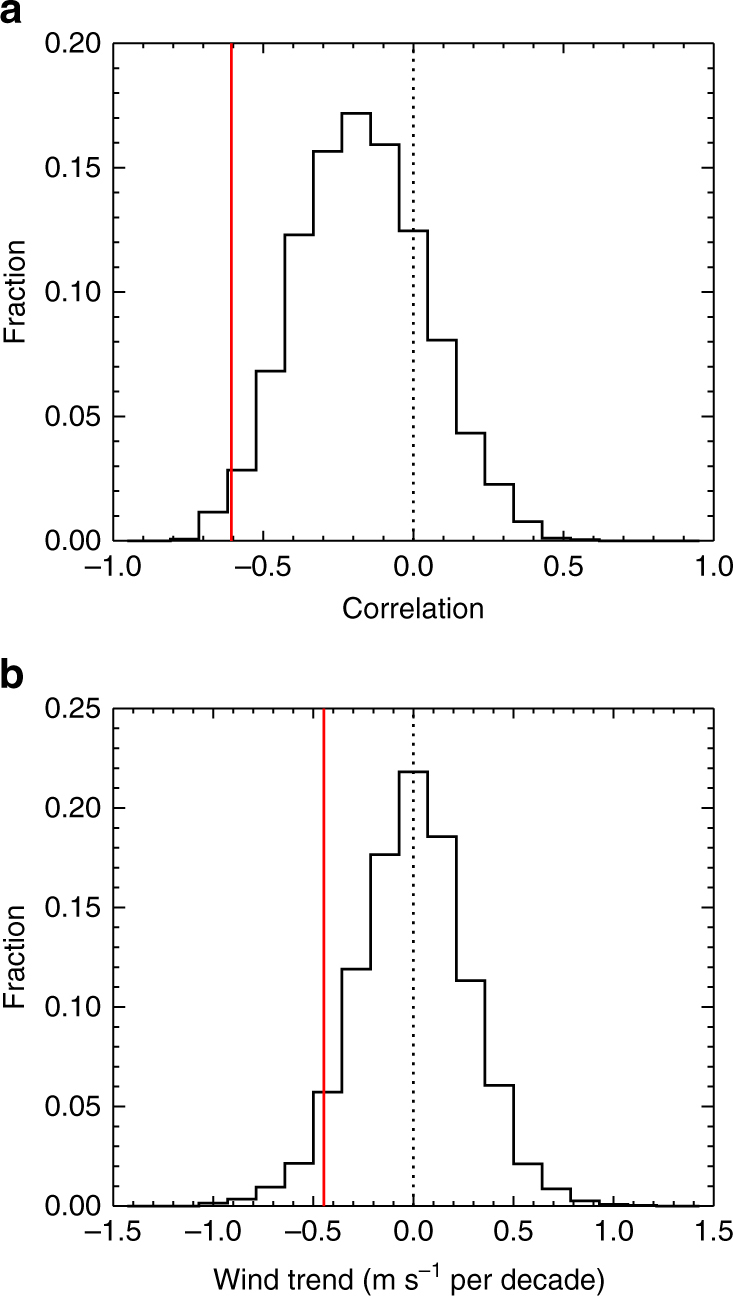
Analysis of CMIP5 simulations. a Distribution of the correlation coefficients of averaged October zonal wind and the following western Ross Sea March ice area and b the distribution of trends in the averaged October zonal wind. The observed values are shown by the red line. Analysis is performed on all possible 37-year segments of the model simulations for a direct comparison with the 37-year (1979–2015) observed timeseries. For the analysis shown here, October zonal winds are averaged over the region shown by the black box on Fig. 4b