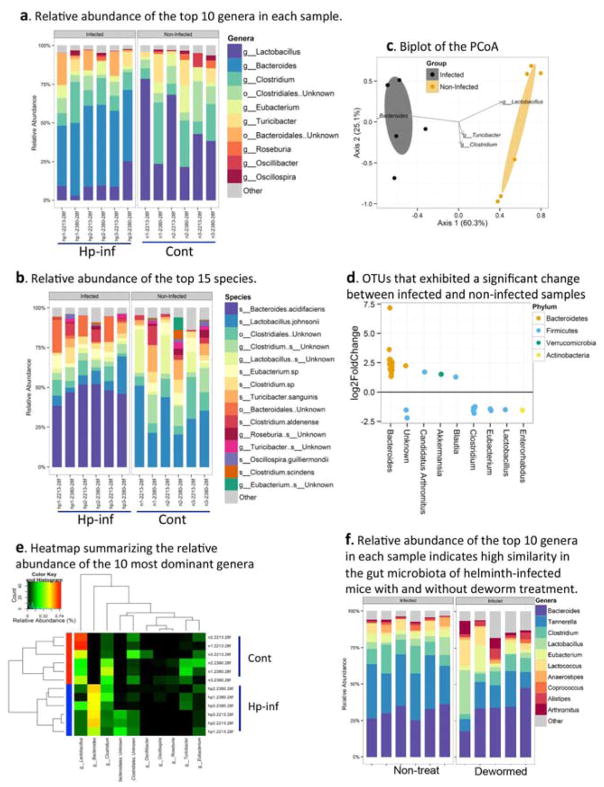
Figure 1. H. polygyrus-infection induces alterations of intestinal microbiota in Balb/c mice.
The results are 16S rRNA gene sequence data from fecal pellets of control and H. polygyrus-infected Balb/c mice (2 weeks post-infection). a. Taxonomic classifications at the genus level showing the relative abundance of the top 10 genera in each sample. b. Relative abundance of the top 15 species in each sample. c. Biplot of the Principle Coordinates Analysis (PCoA), based on Bray-Curtis distances. Ellipses represent the 95% confidence interval around group centroids, and the test for group differences shows P=0.005. Arrows indicate the contribution of individual taxa to the PCoA axes, and only those taxa with the largest contributions are shown. d. OTUs that exhibited a significant change between infected and non-infected samples. Each dot represents an individual OTU. Positive values indicate an increase relative to non-infected, and negative values indicate a decrease. OTUs are grouped by the genus (x-axis) in which they belong, and are color coded by phylum. e. Heat map summarizing the relative abundance of the 10 most dominant genera. Samples are sorted based on hierarchical clustering of Bray-Curtis distances, and infection is highlighted via the colors on the left. The order of taxa is determined by a hierarchical clustering of Euclidean distances among taxa. f. Relative abundance of the top 10 genera in each sample showed high similarity in the gut microbiota of helminth-infected mice with and without deworming treatment.

