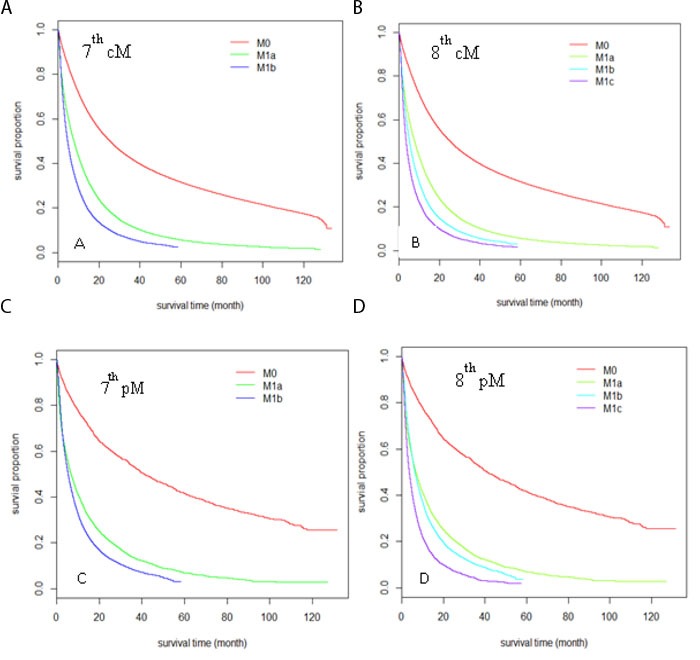
Figure 2. Kaplan-Meier survival curves comparison among different M stages sub-groups.

Sub-groups were defined by clinical M stage according to the 7th edition A., and the 8th edition B. sub-groups were defined by pathological M stage according to the 7th edition C. and 8th edition D.
