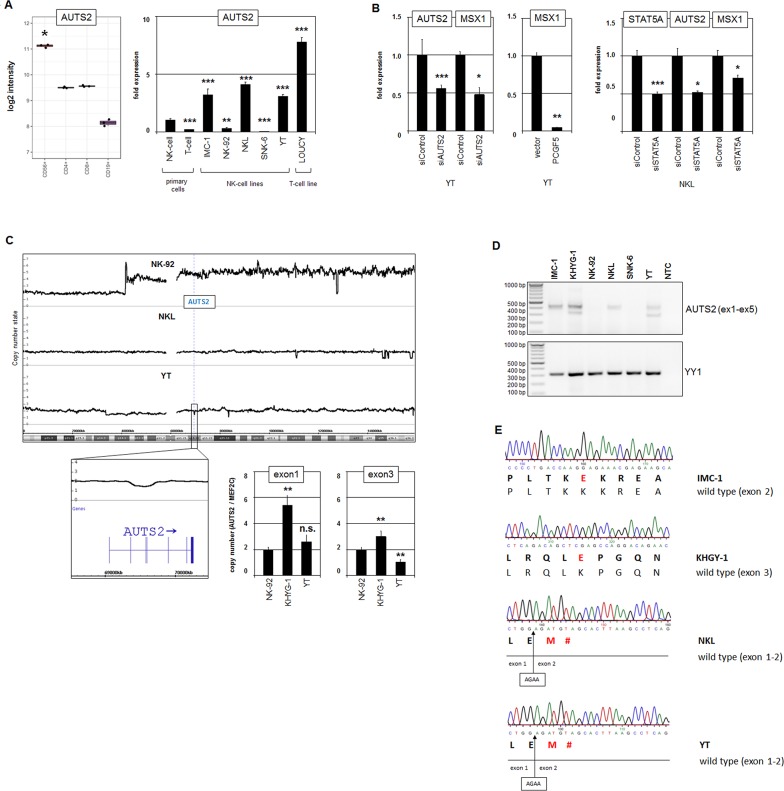
Figure 2. Analysis of AUTS2 in NK-cell lines.
(A) Expression profiling data for AUTS2 of CD56+ NK-cells, CD4+ T-cells, CD8+ T-cells and CD19+ B-cells obtained from dataset GSE72642 are depicted as a boxplot (left). RQ-PCR analysis of AUTS2 expression in primary NK-cells and T-cells and 5 NK-cell lines and T-cell line LOUCY which has been shown to express aberrantly enhanced AUTS2 (right). The values and statistics are given in relation to primary NK-cells. (B) RQ-PCR analysis of MSX1 expression after siRNA-mediated knockdown of AUTS2 in YT cells (left), after forced expression of PCGF5 (middle), and RQ-PCR analysis of AUTS2 and MSX1 expression after siRNA-mediated knockdown of STAT5A in NKL cells (right). (C) Copy number analysis of the AUTS2 locus in NK-cell lines by genomic profiling (above) and RQ-PCR (below). Data indicate a small deletion targeting exons 3 and 4 of AUTS2 in YT cells. RQ-PCR data indicate genomic deletion of exon 3 in KHYG-1 cells as well. (D) RT-PCR analysis of AUTS2 exons 1 to 5 (above) and of YY1 for control (below). Note an additional smaller PCR product in KHYG-1 and YT cells. (E) Sequence analysis of RT-PCR products revealed particular AUTS2 mutations in the NK-cell lines IMC-1, KHYG-1, NKL and YT.

