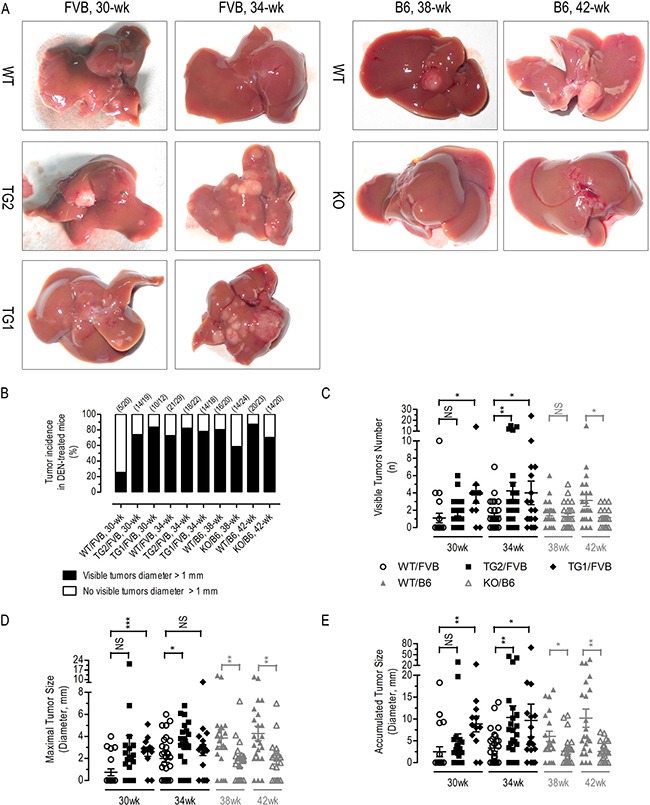
Figure 5. DEN-induced HCC in liver-specific AR overexpressing transgenics and Ar knockout mice.

Typical liver photos (A) tumor incidence (B) (n = 12–29), visible tumor number (C) (n = 12–29), maximal tumor size (D) (n = 12–29), and accumulated tumor size (E) (n = 12–29) of different groups of DEN-treated mice. Numerical data were expressed as the mean ± SEM. NS, not significant; *p < 0.05; **p < 0.01; ***p < 0.001 (TG2/FVB or TG1/FVB versus WT/FVB, KO/B6 versus WT/B6).
