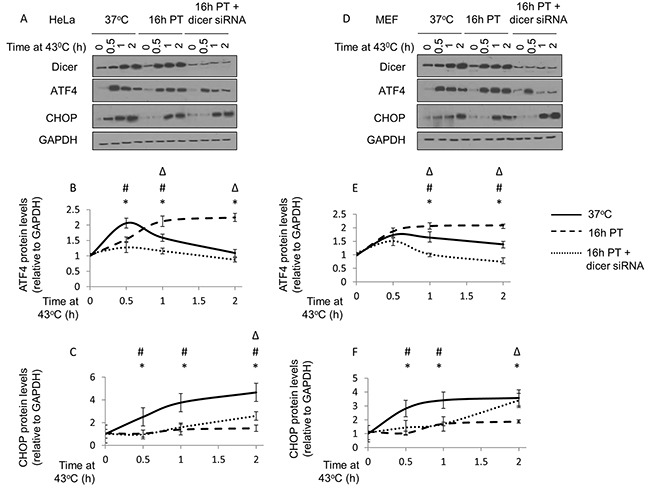
Figure 7. Elevated dicer protein levels observed during mild (39.5°C) hyperthermia-induced thermotolerance is associated with a pro-survival phenotype in HeLa and MEF cells.

(A) Western blot analysis of dicer, ATF4, CHOP and GAPDH protein levels in control (37°C), mild hyperthermia (39.5°C) pretreated (16h PT), and mild hyperthermia pretreated dicer knockdown (16h PT + dicer siRNA) HeLa cells challenged with a heat shock (43°C) insult for 0, 0.5, 1 and 2h. (B) ATF4 band intensities in (A) were first normalized to GAPDH band intensities corresponding to ATF4 (not shown) and further normalized to the 0h time point in the control (37°C) group. Statistically significant (p<0.05) differences between control and 16hPT (*); control and 16hPT + dicer siRNA (#); and 16hPT and 16h PT + dicer siRNA (Δ) are displayed. (C) CHOP band intensities in (A) were first normalized to GAPDH band intensities corresponding to CHOP (not shown) and analyzed as described in (B). (D) Western blot analysis as described in (A) conducted in MEF cells. (E) ATF4 band intensity analysis as described in (B) conducted in MEF cells. (F) CHOP band intensity analysis as described in (C) conducted in MEF cells. The representative western blot images for GAPDH correspond to the western blot image for dicer in this figure. Values shown are mean ± SEM. n=3, *p<0.05 (37°C v/s 16hPT), #p<0.05 (37°C v/s 16hPT + dicer siRNA), Δp<0.05 (16hPT v/s 16hPT + dicer siRNA).
