
Figure 4. Mucin mRNA expression in cancer.
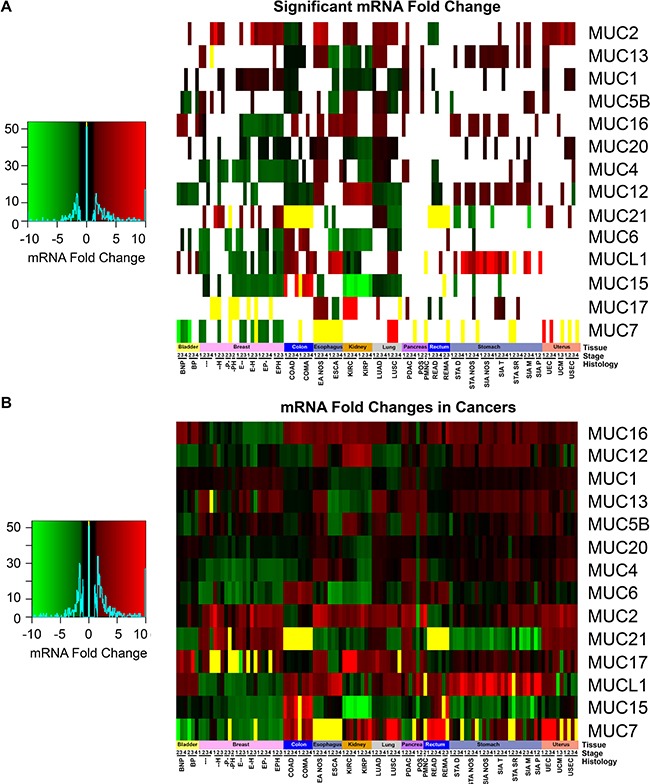
mRNA cohorts were separated based on histology and stage, in which a minimum size of two was taken. Supplementary Table 1 contains the full cohort names and sample sizes. Fold change of mRNA in cancer was compared in relation to adjacent non-cancerous normal tissues. If either all the cancer or normal tissue had zero expression, the fold change was set to zero and colored yellow. (A) Cohorts which had a significant fold change as determined by a Mann-Whitney (p < 0.05) were colored. Cases where Mann-Whitney testing would be impractical had the yellow bars appear in the heatmap. All other cases (p > 0.05) have white where the fold change is insignificant statistically. (B) The fold change between normal tissue and the cancer cohort was displayed regardless of significance. Heatmap color scales are depicted on the left.