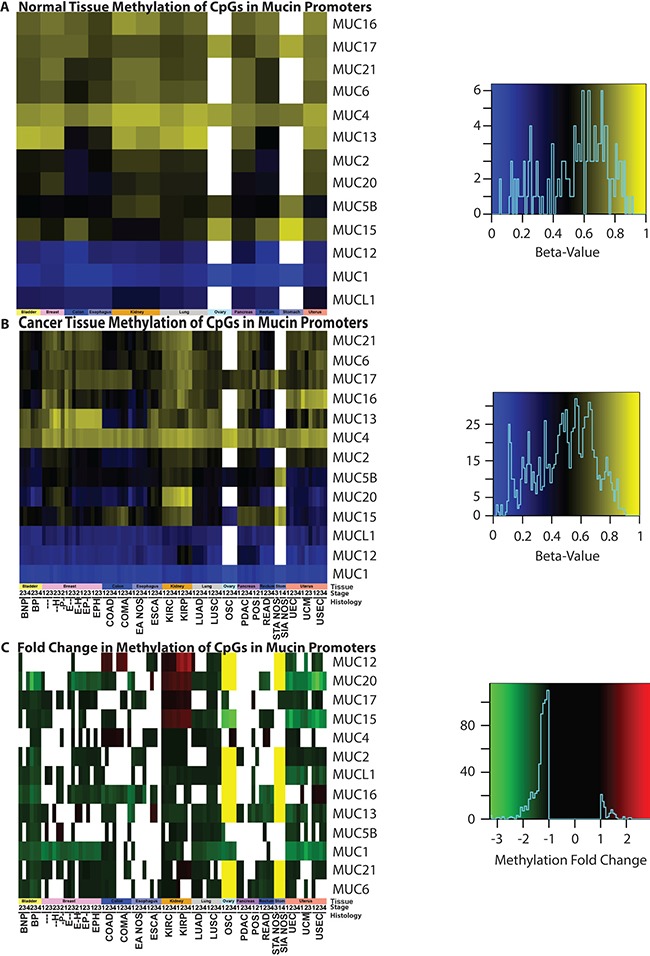
Figure 7. Methylation status of mucins.

Promoter methylation was examined in (A) normal tissue and (B) cancer genomes, as well as (C) the resulting fold change. Significant (p < 0.05) fold changes determined by a Mann-Whitney test are colored, where white indicates a non-significant change between normal and cancer promoters. A yellow bar indicates that a 27K methylation chip was analyzed instead of a 450K chip and the gene was not examined in the chip. A minimum sample size of two was required for each cohort. Supplementary Table 1 contains the full cohort names and sample sizes. Heatmap color scales are depicted on the right.
