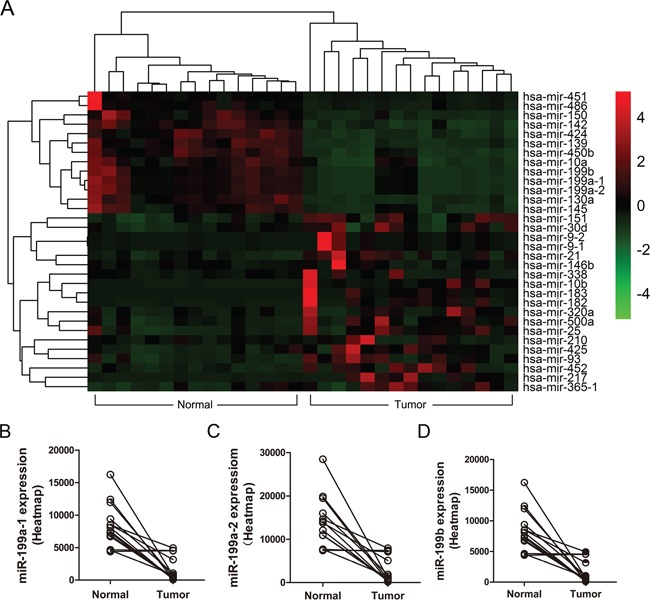
Figure 1. Heatmap analysis of miRNA expression in human HCC patient samples.

(A) The heatmap analysis was performed by R software with DESeq package (p <0.05 and log2 fold change >1) to illustrate miRNA expression profiles in 15 HCC cases and matched normal liver tissues. (B-D) The expression levels of miR-199a-1, miR-199a-2, miR-199b in HCC tumor and normal liver tissues based on the heatmap miRNome profiles for 15 HCC patient samples (tumor and adjacent normal liver tissues).
