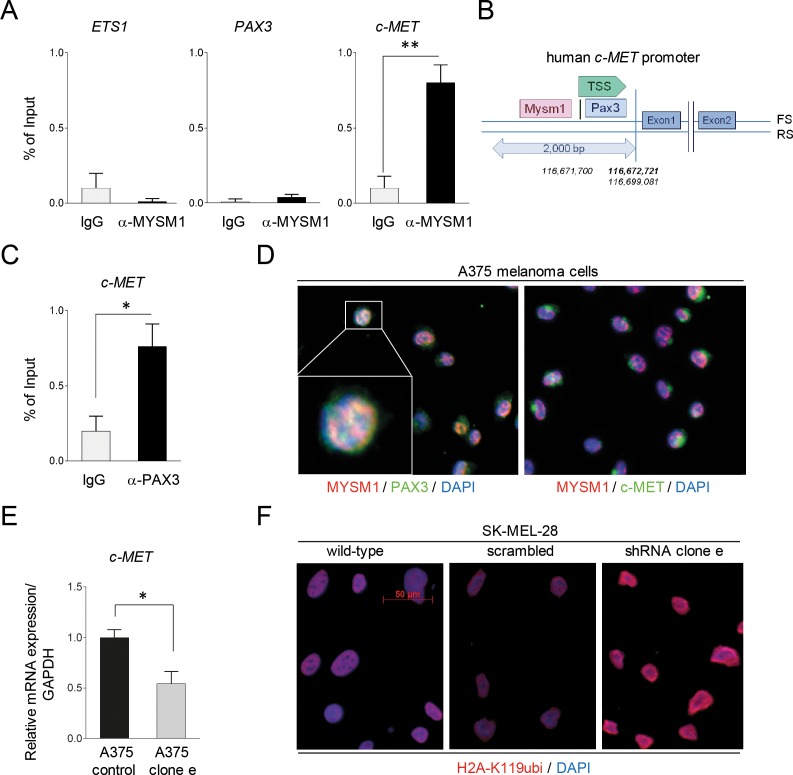
Figure 5. Binding of MYSM1 to the human c-MET promoter and co-localization with PAX3 and MET in A375 melanoma cells.
(A) ChIP analysis of MYSM1 binding to a 200 bp fragment close to the TSS of the human PAX3, ETS1, and c-MET promoter regions in A375 cells. Bar graphs represent mean values from at least three independent experiments with standard deviations and p-values as indicated. (B) Graphical illustration of the localization of the PAX3 consensus DNA binding site and the estimated MYSM1 interaction site in the human c-MET promoter region using BLAST data. (C) Detection of PAX3 binding to an established motive of the c-MET promoter region in A375 cells by ChIP analysis. (D) IF analysis of the co-localization of MYSM1 with PAX3 in the nuclei of growing A375 melanoma cells and with c-MET in the cytoplasm (first panel: MYSM1 red, PAX3 green, double-positive areas of nuclear co-localization in yellow; second panel: c-MET green). (E) qPCR analysis of c-MET mRNA expression in MYSM1-silenced in comparison with scrambled control A375 melanoma cells relative to GAPDH (bar graphs represent mean values from at least three independent experiments with standard deviations as indicated). (F) IF analysis of SK-MEL-28 wild-type and MYSM1 knockdown melanoma cells (expressing shRNA cl. e) with an antibody against H2A-K119ubi (in red, representative images).

