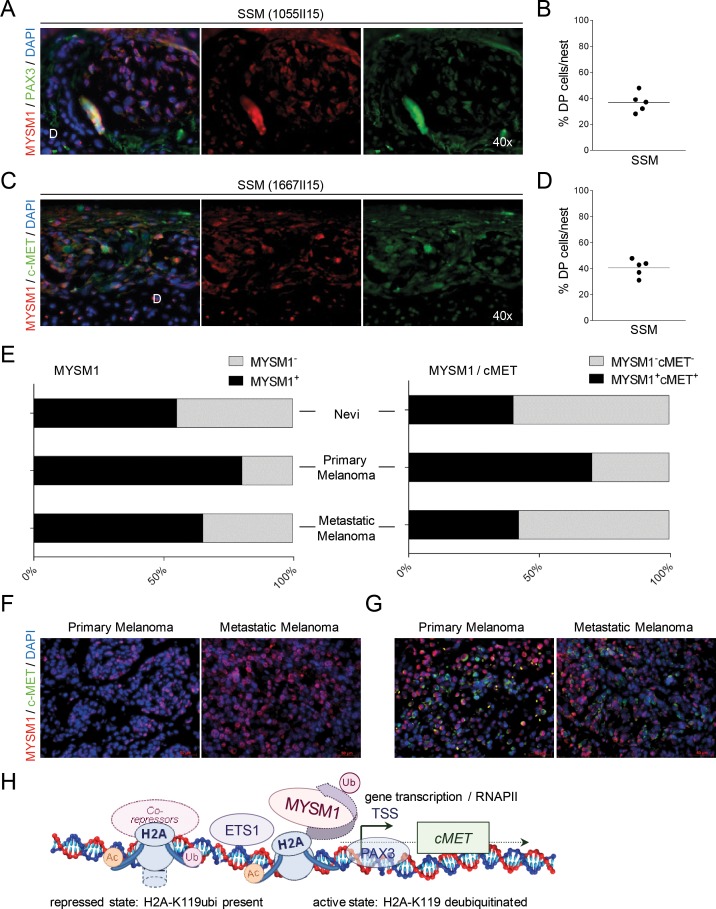
Figure 6. Co-localization of MYSM1 with PAX3 and c-MET in human SSM samples.
(A-D) Representative microphotographs of IF analyses of SSM sections from at least 5 different melanoma patients. For orientation, position of the dermis (D) is indicated. (A) Nuclear co-localization of MYSM1 with PAX3 in human melanoma samples (MYSM1 red, PAX3 green, DAPI-stained nuclei in blue, co-localization areas yellow, original magnification 40X). (B) To quantify MYSM1+, PAX3+ and MYSM1+PAX3+ double-positive cells in SSM samples, positively stained cells in these three categories were counted. For all measurements, the median of specifically stained cells counted in at least 15 high-power fields is presented (sample size n>3). (C) MYSM1-expressing cells in SSM sections are often positive for c-MET in the cytoplasma (MYSM1 red, MET green, DAPI-stained nuclei in blue). (D) Single- and double-positive cells for MYSM1 and MET were counted and medians calculated according to B. (E) Evaluation of MYSM1 expression and co-expression with c-MET in a melanoma tissue microarray (TMA, US Biomax ME1004e) with 82 melanoma cases and 18 nevi cases by IF staining with an antibody against MYSM1 as well as c-MET. Bar graphs show the percentages of primary and metastatic melanoma as well as nevi samples with significant MYSM1 detection (right panel) and with MYSM1 and c-MET co-expression (left panel). (F) Representative IF images of MYSM1 expression in cutaneous melanoma and in lymph node metastases. (G) IF analysis of co-expression of MYSM1 and c-MET in representative TMA samples (MYSM1 in red, c-MET in green, DAPI-stained nuclei in blue). (H) Proposed simplified model of MYSM1 function as co-factor regulating c-MET transcription in melanoma cells.

