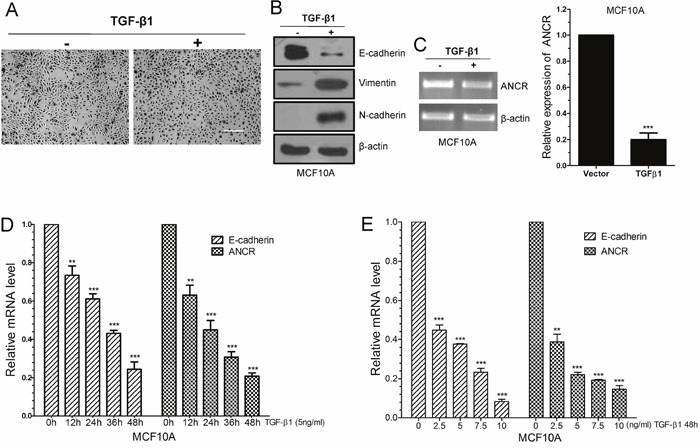
Figure 1. LncRNA ANCR was down-regulated in TGF-β1 induced EMT.

(A) The morphological change of MCF10A cells after treated by TGF-β1, as examined by phase contrast microscopy. Scale bars: 200 μm. (B) Western blots of the epithelial marker E-cadherin, and the mesenchymal markers (N-cadherin, Vimentin) in MCF10A treated by TGF-β1. (C) RT-PCR and Real-time PCR analysis of ANCR expression in TGF-β1treated MCF10A cells. (D) Real-time PCR analysis of ANCR and E-cadherin mRNA expression upon TGF-β1 treatment in different time. (E) Real-time PCR analysis of ANCR and E-cadherin mRNA expression upon TGF-β1 treatment in different dose. The data are presented as the mean±S.D. (n =3; **P<0.01, ***P<0.001, Student’s t-test).
