
Figure 3. Gene expression of 5 melanoma-specific genes in samples from healthy controls, spiked samples and CTC fractions from metastatic melanoma patients after slanted enrichment.
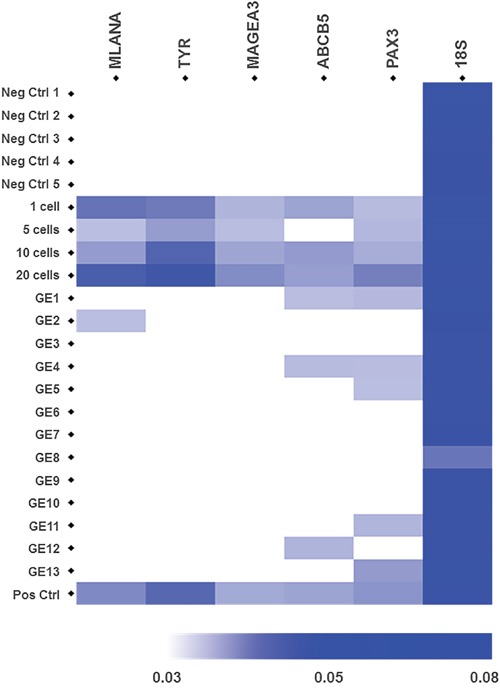
Heatmap represents the expression levels of the melanoma-associated genes MLANA, TYR, MAGEA, ABCB5 and PAX3, which were assessed by RT-PCR. The 18S rRNA gene was used as an endogenous control. Cellular fractions after slanted processing of the blood from 5 healthy controls were used as negative controls. Spiked samples with 1, 5, 10 and 20 A2058 melanoma cells in a background of 1 × 10⁵ WBCs were used to demonstrate the detection level of this assay. CTC-enriched fractions from 13 metastatic melanomas were interrogated. Spiked samples with 20 A2058 cells were used as positive controls in every run. Each heatmap square corresponds to the reciprocal value of the Ct values for each target gene (1/Ct) for a given sample.