
Figure 7. Comparison between HO-activity of untransfected or GFP expressing control cells and K562 cell lines expressing ER resident HO-1 or the anchorless HO-1 variant.
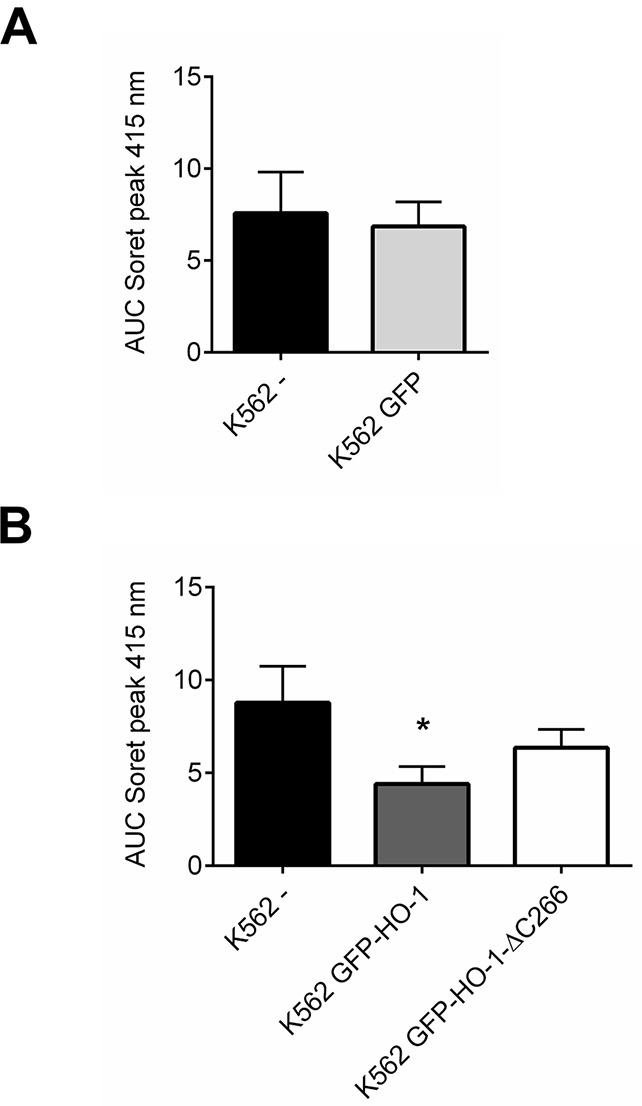
AUCs of the Soret peak at 415 nm were calculated for each cell line. (A) Data from four independent experiments were averaged per group to compare the HO-activity in untransfected K562 with K562 expressing GFP. (B) Data from four independent experiments were averaged per group to compare the HO-activity in untransfected K562 with the HO-activity in cell lines expressing ER anchored GFP-HO-1 and anchorless GFP-HO-1-ΔC266. Error bars show the SEM. * significant compared to untransfected K562 (p<0.05).