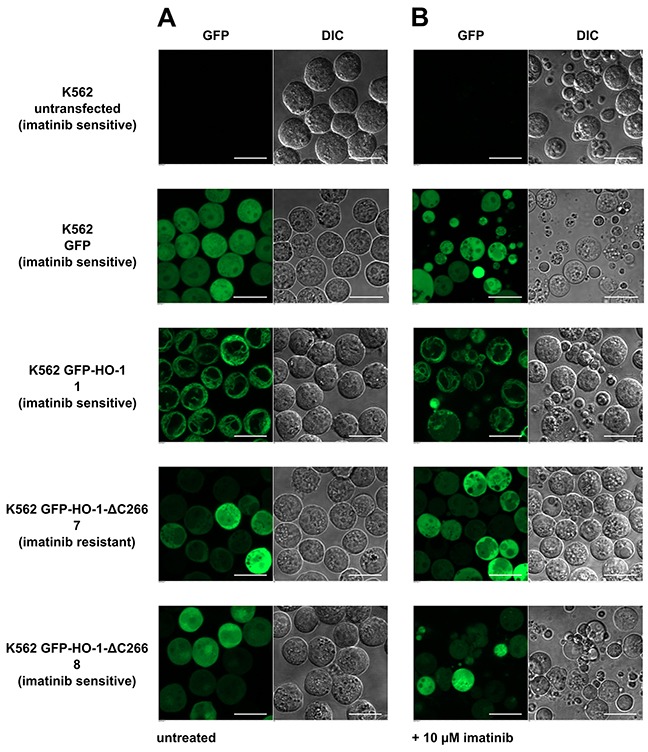
Figure 9. Confocal laser scanning microscopy of selected imatinib treated K562 cell lines.

(A) Untreated. (B) 24 hours after incubation with 10 μM imatinib. Figure shows representative data from five pictures per sample out of three independent experiments on a CLSM at 37°C. DIC: differential interference contrast. Bar represents 20 μm.
