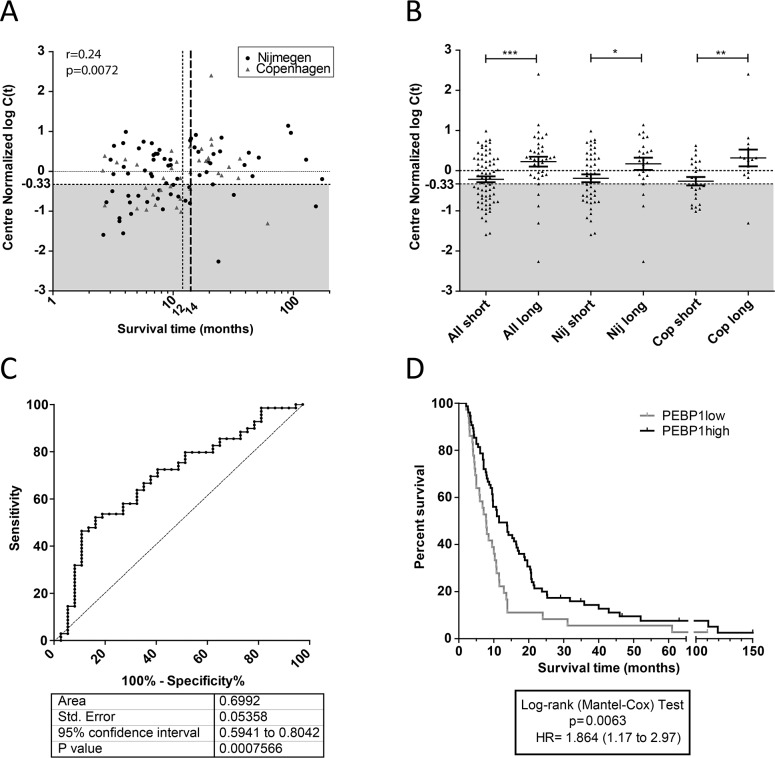
Figure 2. Expression of PEBP1 is of value for treatment decision.
(A) Spearman correlation of center-normalized expression values for PEBP1 with survival time after DC vaccination (one-tailed p-value). Grey area: population of patients with low expression of PEBP1 (<-0.33) that have predominantly a limited survival. Specifically indicated are the original 12-month (dotted line) and the adjusted 14-month (broken line in bold) survival windows. (B) Center-normalized expression of PEBP1 in all evaluated patient samples from Nijmegen and Erlangen (discovery and validation together; one-sides p-values by t-test). (C) Reciever operater curve (ROC) of all Nijmegen and Copenhagen samples combined to select short survivors based on low expression of PEBP1. (D) Kaplan-Meyer curve of patients having a PEBP1 expression level below or above −0.33 (2 log center normalized C(t)).

