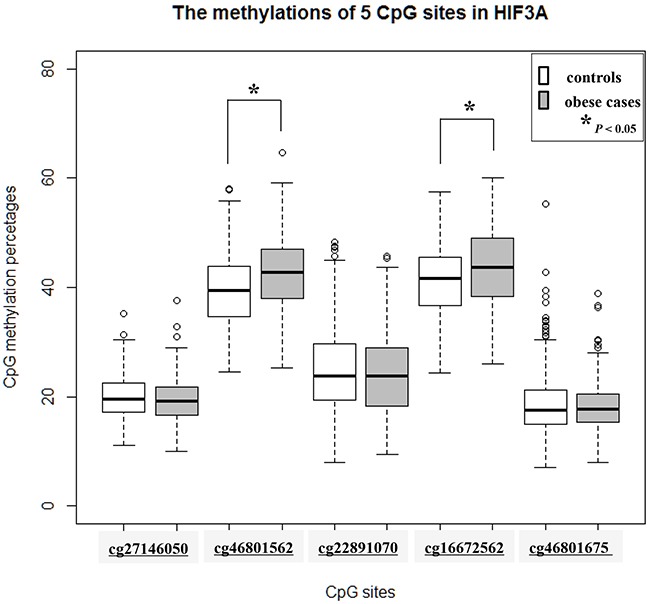
Figure 2. Boxplot of 5 CpG DNA methylation in Korean childhood obesity (n=667).

CpG methylations between the control and cases were compared at 5 CpG sites (cg27146050, cg46801562, cg22891070, cg16672562, and cg46801675). Gray boxes indicate the obese cases. P values <0.05 is indicated as an asterisk (*).
