
Figure 3. Esomeprazole plus sCPG impair tumor cell growth, proliferation and migration.
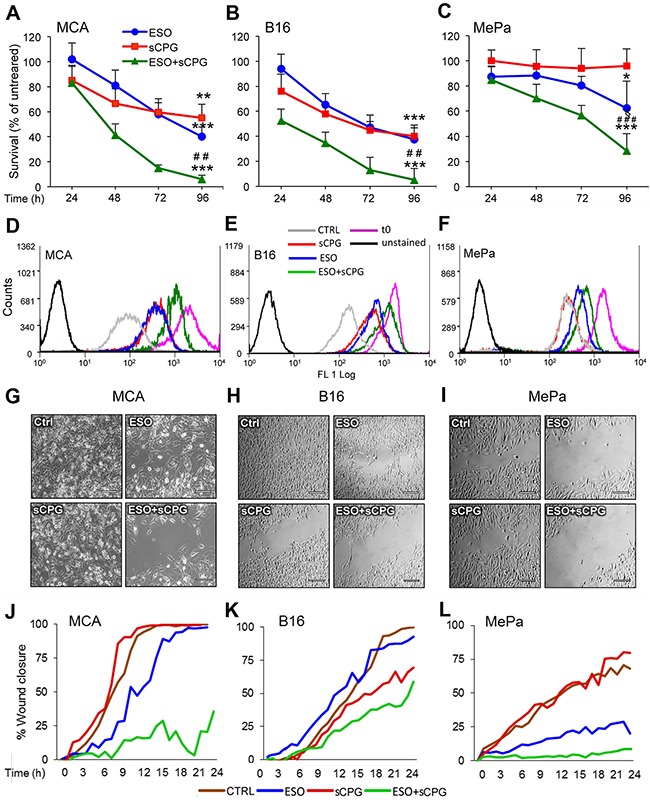
(A-C), Survival rate of MCA (A), B16 (B) and MePa (C) cells treated with ESO (blue circles) and sCPG (red squares), alone or in combination (green triangles) for 24 h, 48 h, 72 h and 96 h was determined by Cristal Violet assay. Data are expressed as percent of untreated cells (mean of 3 experiments ± SEM). Significance of the differences in survival of drug-treated vs untreated cells is shown by asterisk (*P < 0.05, **P < 0.01, ***P < 0.001); significance of the differences in survival of double treated cells vs single ESO or sCPG-treated cells is shown by number sign (##P < 0.01; ###P < 0.001). (D-F), Proliferation rate of cells cultured for 72 h without (gray) or with ESO (blue), sCPG (red) or ESO+sCPG (green) was determined by CFSE assay. The profile of CSFE-loaded cells at t0 is shown in purple; the profile of unstained cells is shown in black. One representative experiment out of 3 is shown. (G-I), Migration of cells untreated (Ctrl) or pretreated 48 h with ESO and sCPG alone or in combination were analyzed in a gap filling assay (see Materials and Methods). Images show frames of a representative video, taken after 16 h 40min (MCA) or 24 h (B16 and MePa) of culture at 37°C. Scale bar corresponds to 200μm. (J-L), Results are represented as percentage of gap closure against time. One representative experiment out of 2 performed is shown.