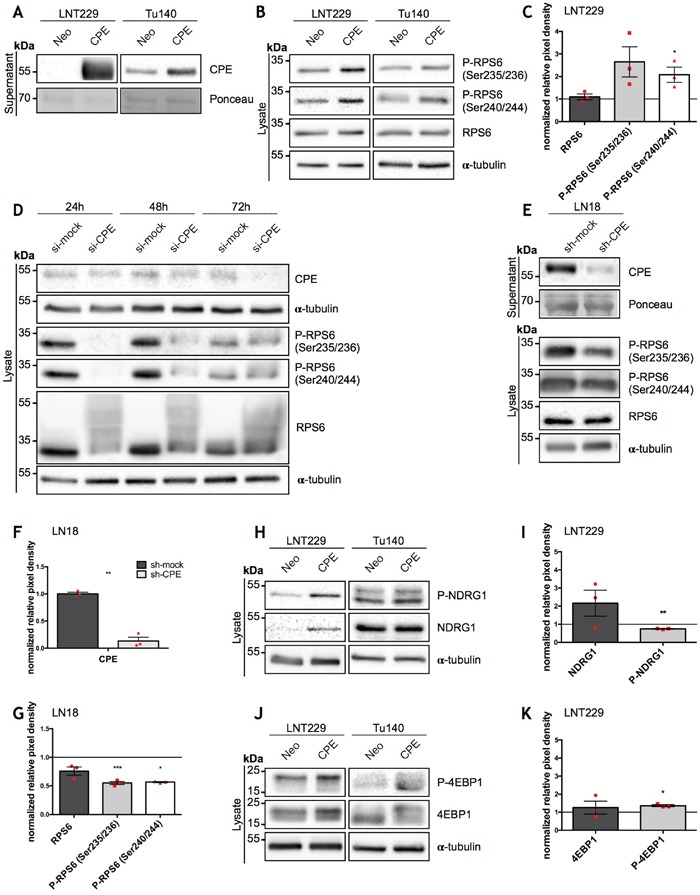
Figure 1. Overexpression of sCPE results in mTORC1 activation while CPE knockdown leads to decrease of its activity.

(A) Immunoblot of sCPE obtained from the supernatants of the sCPE-transfected LNT229 and Tu140 cells. Supernatants derived from Neo LNT229 cells were used as control. Ponceau staining was used as a loading control. The cells were serum-starved for 24h in serum-reduced medium prior to supernatant collection. A representative immunoblot is shown. (B, H, J) Representative immunoblots for detection of phosphorylated and total amounts of RPS6 (B), NDRG1 (H) and 4EBP1 (J) in the sCPE-overexpressing vs. Neo LNT229 and Tu140 cell lysates. α-tubulin was used as a loading control. The cells were serum-starved for 24h in serum-reduced medium prior to lysis. (C, I, K) Quantification of densitometric measurements of immunoblotting results of total as well as phosphorylated amounts of (C) RPS6, (I) NDRG1 and (K) 4EBP1 in the sCPE-overexpressing vs. Neo LNT229 cells (normalized to Neo LNT229 cells; set to 1). Red dots represent single experiments. Ratio-based paired t-test. Mean±SEM; n=3 (C: *p=0.0482; F: **p=0.0052; H: *p=0.0148). (D) A representative immunoblot for detection of CPE as well as phosphorylated and total amounts of RPS6 in the lysates of the transient CPE-knockdown primary GBM Tu140 cells. Control siRNA (si-mock) was used as negative control. α-tubulin was used as a loading control. (E) A representative immunoblot for detection of secreted CPE in the supernatants as well as phosphorylated and total amounts of RPS6 in the lysates of the stable CPE-knockdown LN18 cells. Control shRNA (sh-mock) was used as negative control. Prior to supernatant collection, the cells were serum-starved for 24h in serum-reduced medium. Ponceau and α-tubulin were used as loading controls in the supernatant- and in the lysate, respectively. (F, G) Quantification of densitometric measurements of immunoblotting results of CPE- (F) as well as total and phosphorylated amounts of RPS6 (G) protein levels in the LN18 cell line upon CPE knockdown (in G: RPS6 levels in LN18 sh-CPE cells normalized to LN18 sh-mock cells). Red dots represent single experiments. Ratio-based paired t-test. Mean±SEM; n=3 (F: **p=0.0021; G: ***p=0.0006, *p=0.0439).
