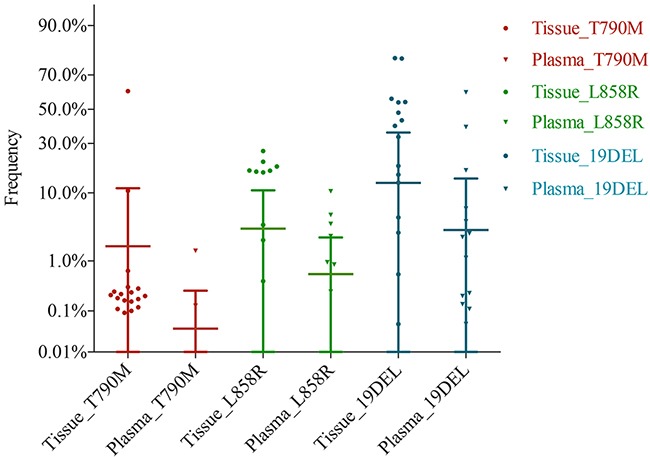
Figure 3. EGFR mutation frequency distribution of paired tumor tissue and plasma.

gDNA and ctDNA were detected in the digital PCR platform, and the frequency of tumor tissue is shown as a dot symbol, while the frequency of plasma is shown as a triangle symbol. Mutation types are shown by different colors. The frequency of plasma was lower than that of tumor tissue, and plasma did not detect a few positive sites in tumor tissue.
