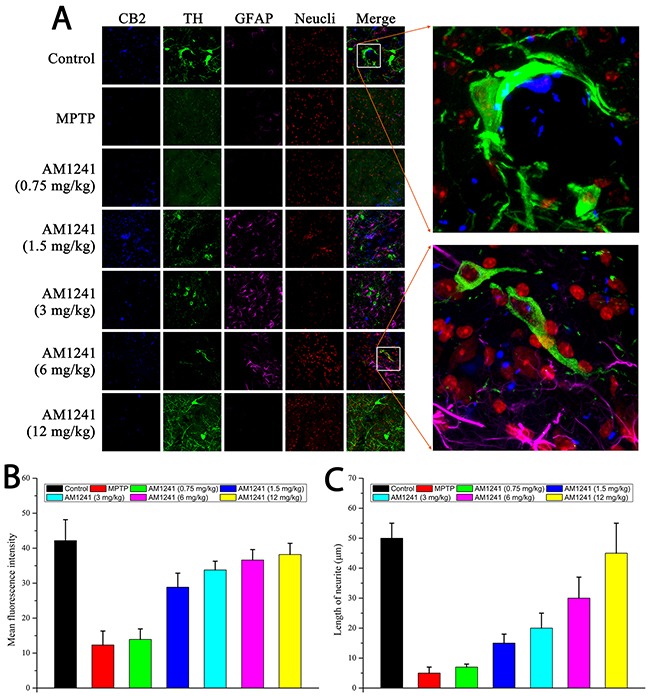
Figure 7. Immuno staining for neurogenesis in substantia nigra of MPTP-induced PD mice.

(A) TH-positive cells represent for DA neurons, GFAP-positive cells represent for astrocytes. The enlarge graphs show the clear axons of DA neurons and the co-localizations of CB2 receptor and TH-positive cells. (B) Histogram of quantification of TH positive cells by mean fluorescence intensity. (C) Histogram of quantification of length of neurite.
