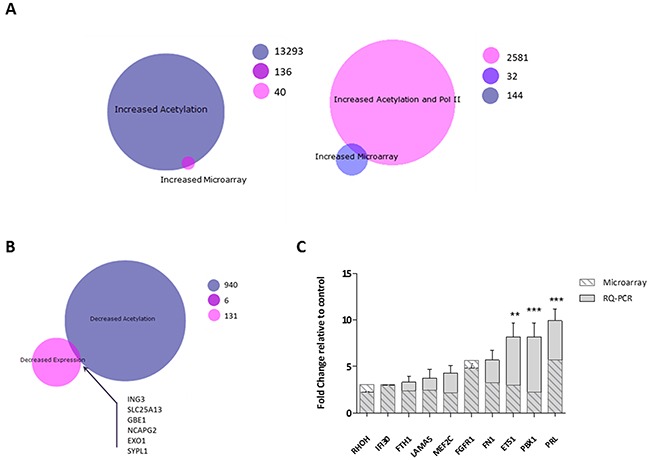
Figure 5. Integrative analysis of Vorinostat induced gene expression changes and alterations in the H3K9 acetylation landscape.

BioVenn diagrams of to determine overlaps between (A) genes with an increase in expression and an increased H3K9Ac binding (left) and genes with an increase in expression and genes associated with an increase in H3K9Ac and Pol II binding (right) (B) genes with a decreased expression and a decrease in H3K9Ac binding. Genes in the overlaps, 136 for the increased acetylation/increased expression and 6 for the decreased acetylation/decreased expression, were mapped for protein-protein interactions in STRING, with (C) expression of genes central for the networked measured by RQ-PCR. Experiment was carried out in a biological replicate of three. Significance, as calculated by two-way ANOVA, is denoted as * = P<0.05, ** = P<0.01 and *** = P<0.001.
