
Figure 1. The EGFR pathway regulates the IBC cell population that expresses CSC markers.
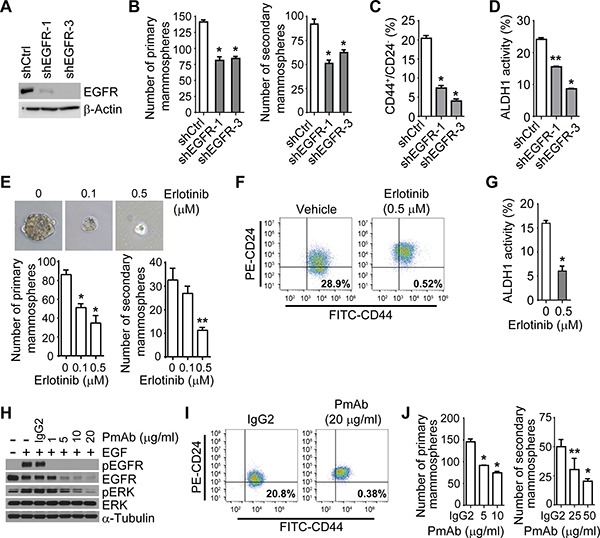
(A) EGFR expression is depleted in SUM149 cells after EGFR knockdown. Expression of EGFR in the stable shCtrl clone and EGFR knockdown clones, shEGFR-1 and shEGFR-3, was analyzed by Western blotting. (B) EGFR depletion reduces the formation of mammospheres in SUM149 cells. Bars, ± SD. *P < 0.001. (C and D). EGFR depletion decreases the CD44+/CD24−/low population (C) and ALDH activity (D) of SUM149 cells. *P < 0.001; **P < 0.01. (E) Erlotinib treatment decreases mammosphere formation of SUM149 cells. Shown are representative images of primary mammospheres. *P < 0.001; **P = 0.001. (F) and (G) Erlotinib treatment decreases the CD44+/CD24−/low population (F) and ALDH activity (G) of SUM149 cells. FITC, fluorescein isothiocyanate; PE, phycoerythrin. *P < 0.01. (H) Panitumumab (PmAb) treatment inhibits EGF-stimulated phosphorylation of EGFR in SUM149 cells. Cells were pretreated with PmAb at the indicated doses for 1 hour and then stimulated with EGF (50 ng/mL) for 15 minutes. (I) PmAb treatment decreases the CD44+/CD24−/low population of SUM149 cells. (J) PmAb treatment decreases the mammosphere formation of SUM149 cells. *P < 0.001; **P < 0.005. Experiments were independently repeated 3 times.