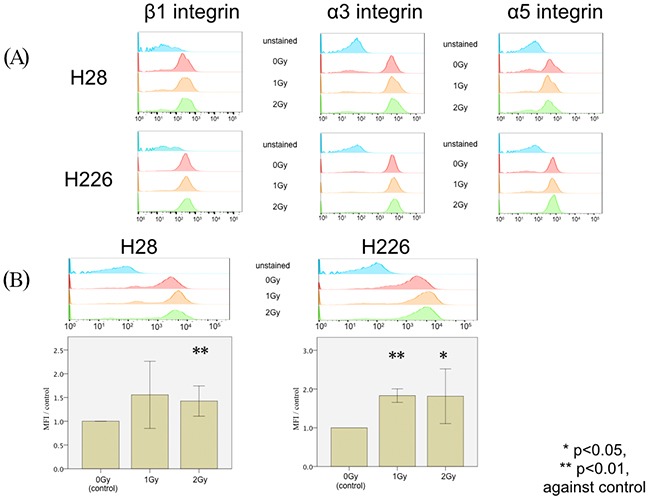
Figure 3. FACS analysis of photon-induced stimulation of expression in cell surface markers.

(A) FACS analysis of the expression of β1 integrin (left column), α3 integrin (middle column), and α5 integrin (right column) does not reveal any difference among H28 (upper row) or H226 cells (lower row) without irradiation, with 1 Gy irradiation, and with 2 Gy irradiation. Unstained cells were analyzed in the same experiment as a negative control. (B) FACS histogram analysis of CXCR4 expression (upper row) upon a single dose of 1 Gy irradiation and 2 Gy irradiation in H28 cells (left) and H226 cells (right) compared to non-radiated cells. Data are given as the normalized ratio of CXCR4 expression compared to non-irradiated cells.
