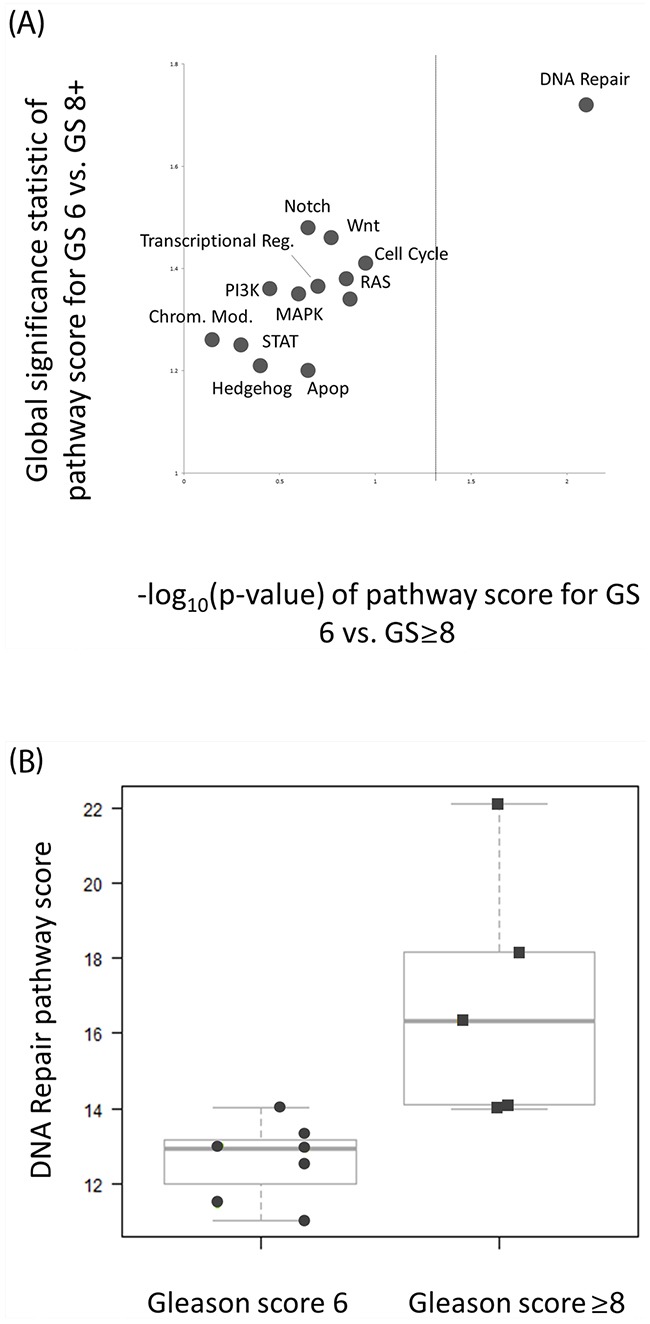
Figure 1. DNA Repair pathway deregulation is significantly associated with GS ≥8 intra-prostatic lesions.

(A) Pathway significance plot for pathway deregulation comparing GS 6 and GS ≥8 lesions. The global significance statistic (y-axis) represents the extent of differential deregulation of the DNA Repair pathway between GS 6 and GS ≥8 lesions. The p-value (x-axis) represents t-test comparison of pathway scores between groups (dashed line represents p = 0.05). Both tests are in agreement to the extent of DNA repair deregulation between groups. (B) Quantitative DNA Repair pathway scores were significantly higher for high risk (GS ≥8) versus low risk (GS 6) lesions. The magnitude of the pathway score represents the magnitude of pathway deregulation.
