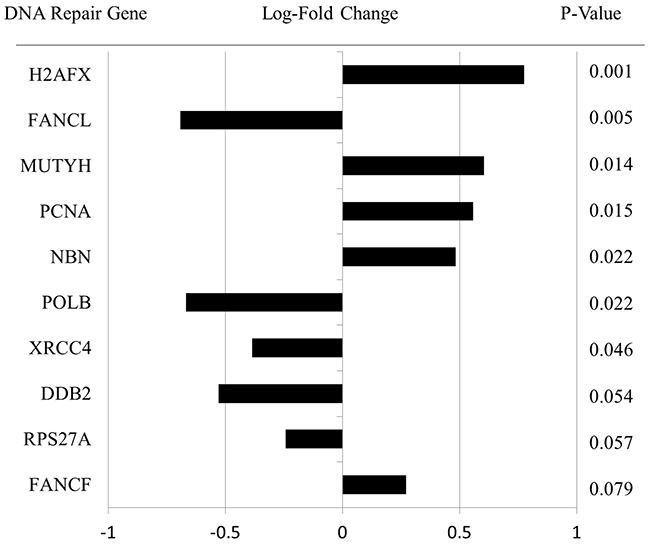
Figure 3. Specific DNA Repair pathway gene expression data for all lesions.

These genes represent the 10 most differentially expressed DNA Repair genes for GS ≥8 versus GS 6 with a positive value corresponding to increased expression of that gene in GS ≥8 versus GS 6 IPLs. The magnitude and direction of log-fold change in gene expression is shown along with p-value of the significance of difference between GS 6 and GS ≥8 IPLs.
