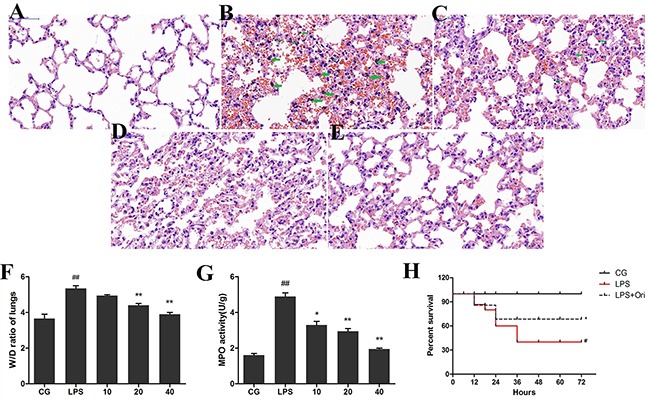
Figure 2. Histopathological analysisof lung tissues (HE, 200x). Lungs from each experimental group were processed for histological evaluation.

(A) Lung tissue of the control group, (B) the LPS group, and (C) to (E) the Ori-treated groups (10, 20, 40 μg/mL, respectively). The green arrows indicate alveolar macrophages. Effects of Ori on lung W/D ratio (F) and MPO activity;“g” represents tissue weight (G). CG is the control group; LPS is the LPS group; and 10, 20 and 40 represent the Ori-treated groups at 10 mg/kg, 20mg/kg and 40mg/kg of Ori per animal, respectively. The values are shown as the means ± SEM (n=3). (H) Administration of Ori improved survival during ALI. Oridonin (Ori) was administered after establishment of LPS-induced ALI (3 mg/kg). Kaplan–Meier survival curve shows that Ori significantly improved the survival rate during 72 h compared to the LPS group. Data represent the mean ±SEM (n = 15), #p< 0.05, ##p< 0.01 versus CG; *p< 0.05, **p< 0.01 versus LPS.
