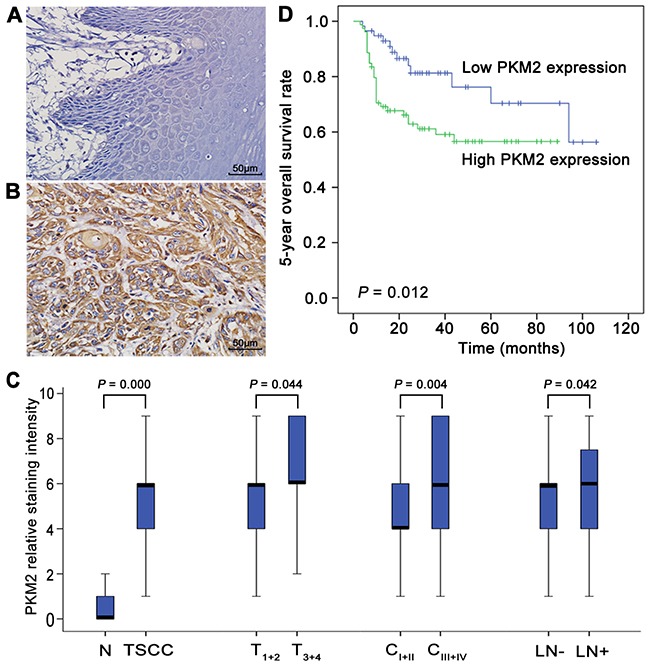
Figure 1. PKM2 deregulation in the development of TSCC and patient prognosis.

PKM2 expression in normal tongue tissues (A) and TSCC tissues (B) was analysed by IHC. (C) Box plots present a comparison of PKM2 expression in normal tongue tissue samples and tissue samples from TSCC cases with different tumour stages, different clinical stages, and with or without lymph node metastasis. Each box represents the 25th to the 75th percentile of the observations, and the line in the middle of the box represents the median. (D) Kaplan–Meier plots of the 5-year OS in patient groups as defined by PKM2 expression. The differences in survival rates are statistically significant between the high and low PKM2 expression groups (P=0.012). The numbers of cases in the high PKM2 expression group and low PKM2 expression group were 79 and 58, respectively. Scale bar: 50 μm.
