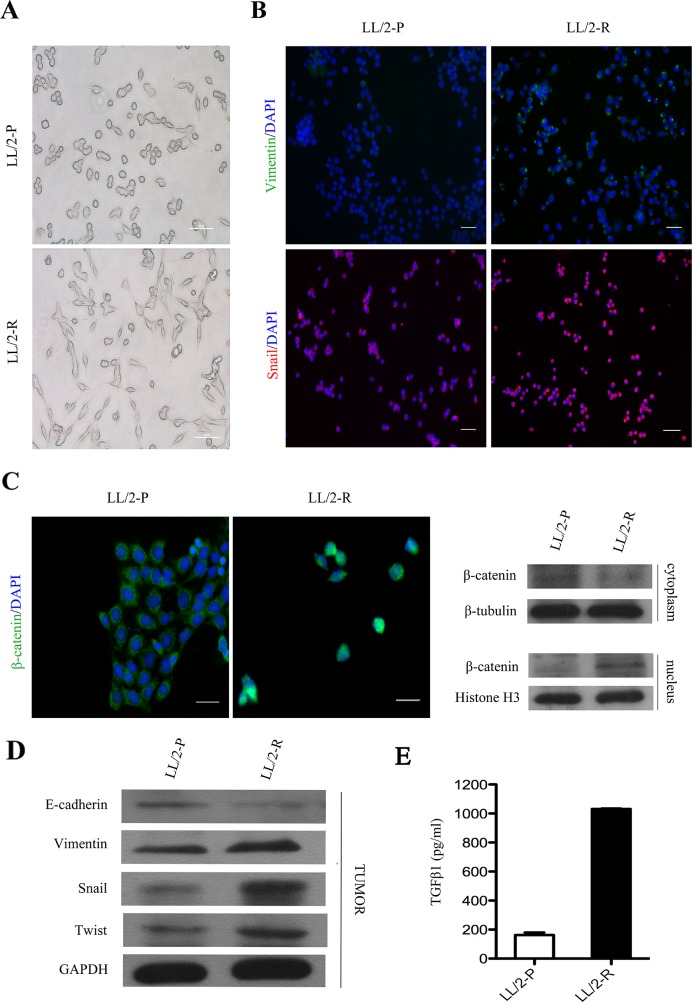
Figure 4. EMT of LL/2-R cell subline both in vitro and in vivo.
(A) The morphology of LL/2-P and LL/-R cells. Scale bars, 100μm(×100). (B) Immunofluorescence images of LL/2 cell sublines. First row, vimentin imunolocalisation (green colour) was detectable in LL/2-R cells, but absent from LL/2-P cells. Second row, snail imunolocalisation (red colour) in nucleus was stronger in LL/2-R cells. Cell nuclei are coloured blue after staining with DAPI. Scale bars, 100μm (×100). (C) Nuclear translocation of β-cateninin LL/2-R cells. Immunofluorescence images displayed that β-catenin (green colour) gave nuclear foci pattern of imunolocalisation in LL/2-R cells, but diffuse cytoplasmic pattern in LL/2-P cells. Western blotting also showed that the β-catenin level of nucleus was upregulation, but that of cytoplasm was downregulation in LL/2-R cells. Cell nuclei are coloured blue after staining with DAPI. Scale bars, 50μm(×400). β-tubulin and Histone H3 were used as loading controls respective for cytoplasmic and nuclear protein. (D) Alterations in EMT marker in LL/2-R tumors. Western blotting revealed that E-cadherin was downregulation, and vimentin, snail and twist were all upregulation, with GAPDH as a loading control in LL/2-R tumors. Three independent experiments were conducted. (E) The TGFβ1 level was significantly increased in LL/2-R cells, which is measured by ELISA assays.

