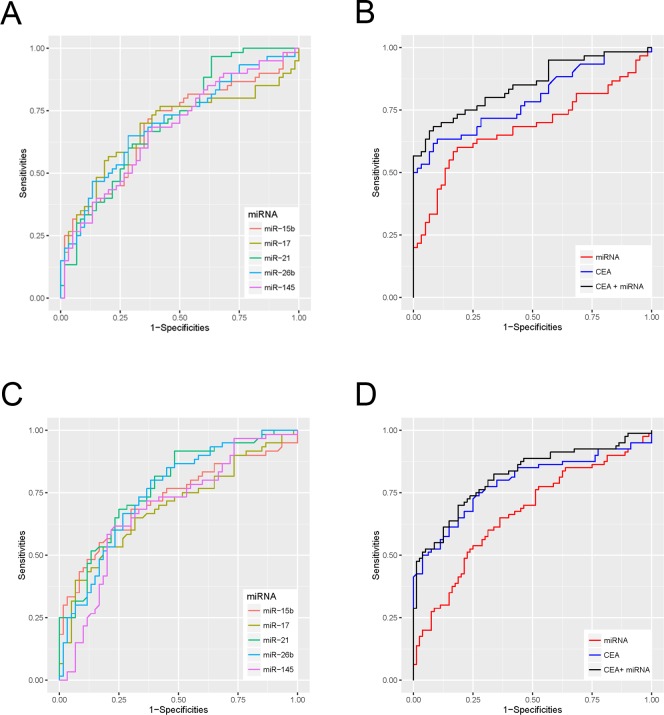
Figure 4. Receiver Operating Characteristic (ROC) curves for dysregulated miRNAs and diagnostic models in the training and the validation cohort.
(A) ROC curves for the diagnostic performances of dysregulated miRNAs in the training cohort. (B) ROC curves for the diagnostic performances of the 5 miRNAs + CEA, the 5 miRNAs alone, and CEA alone in the training cohort. (C) ROC curves for the diagnostic performance of the 5 dysregulated miRNAs in the validation cohort. (D) ROC curves for the diagnostic performances of 5 miRNAs + CEA, 5 miRNAs alone, and CEA alone in the validation cohort.

