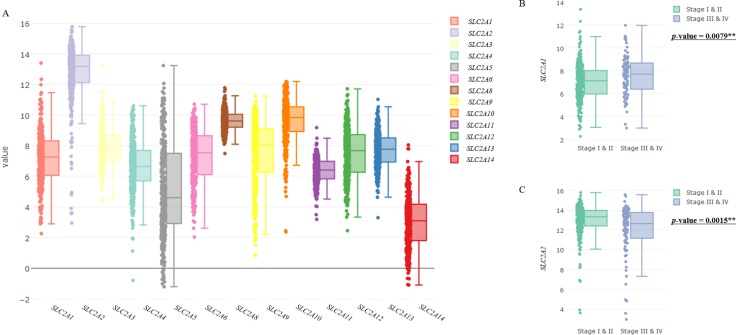
Figure 1. Expression levels of SLC2A family members in HCC and their association with clinical stages.
(A) Boxplots represent mRNA expressions of SLC2A family members. (B, C) Relations between clinical stages and the expression levels of SLC2A1 (B) and SLC2A2 (C) were exhibited using boxplots and scatterplots. Central lines in boxes represent medians, boxes show interquartile ranges (IQR), and error bars show the full range of values, excluding outliers defined as being more than ± 1.5 IQR outside boxes. Scatter plots represent raw data. The p-value in Figure 1B and 1C means results of two-sample location test of gene expression levels in Stage 1 & II vs Stage III & IV.

