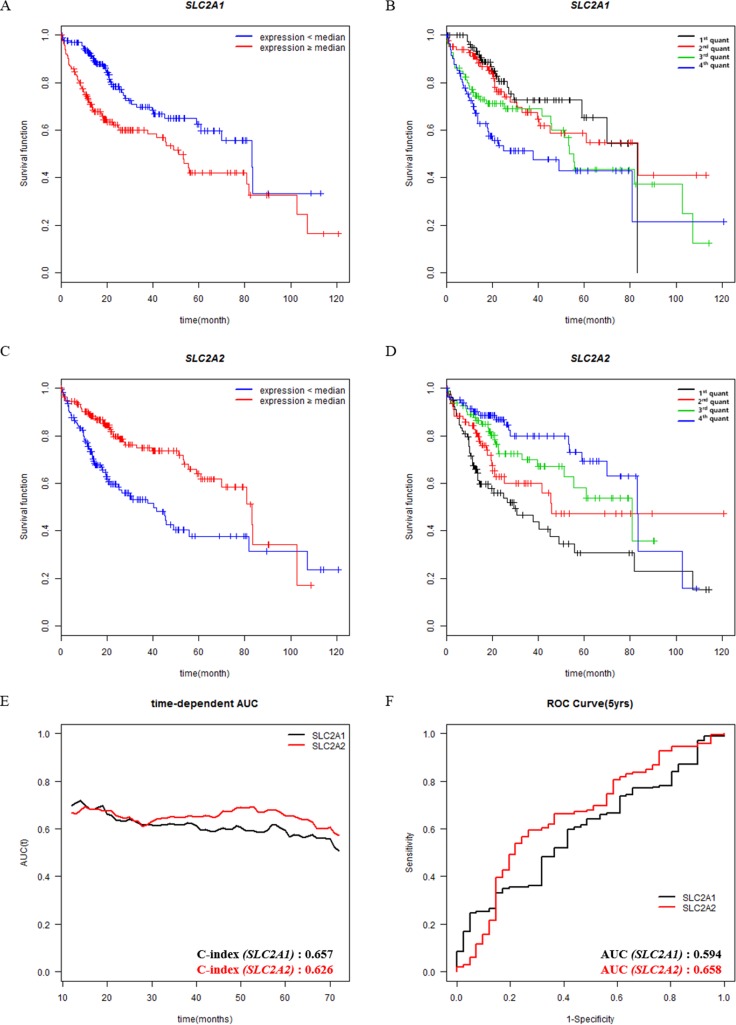
Figure 2. Survival analysis according to the expression levels of prognostic genes in patients with HCC.
(A, B, C, D) Overall survival analysis of HCC patients with respect to the expression levels of SLC2A1 or SLC2A2 was performed by Kaplan-Meier analysis. (A, C) Expression levels of genes are classified into low or high compared with the median (blue or red lines, respectively). (B, D) Expression levels of genes are classified into four from lowest quantile (1st quant) to highest quantile (4th quant). (E, F) Time-dependent Area Under the Curve (AUC) and Receiver Operating Characteristic (ROC) curve at 5 years according to the continuous expression values of SLC2A1 or SLC2A2. Both C-index and AUC value at 5 years are described at the bottom right position of E and F.

