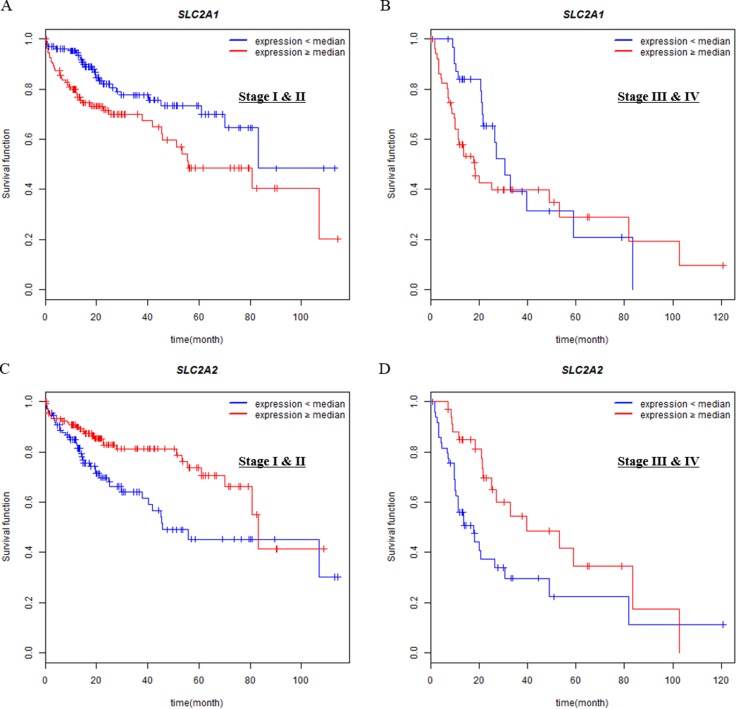
Figure 3. Associations of SLC2A1 or SLC2A2 expressions with overall survival in different tumor stages (I & II vs III & IV).
Overall survival analysis of HCC patients with respect to the expression levels of SLC2A1 or SLC2A2 was performed by Kaplan-Meier analysis. Expression levels are classified into low or high compared with the median (blue or red lines, respectively). (A, C) The curves were analyzed in Stage I & II group. (B, D) The curves were analyzed in Stage III & IV group.

