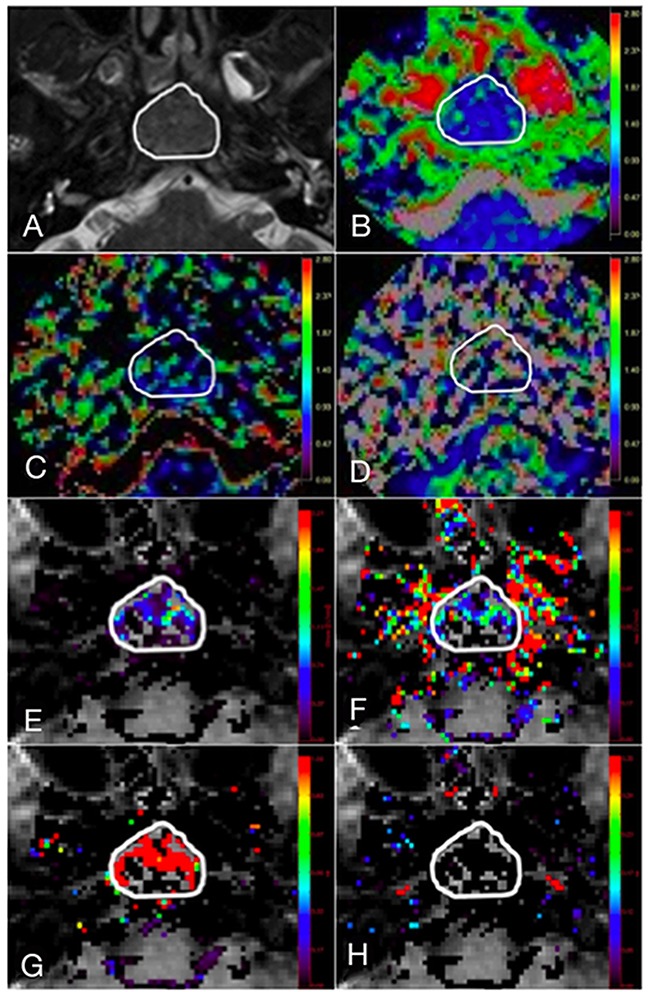
Figure 4. A 45-year-old male with stage T3 NPC.

(A) Axial T2-weighted image showing region of interest (ROI) contouring the margin of the NPC, with subsequent co-registration of the ROI onto corresponding (B) diffusion map, D; IVIM MR perfusion related maps, (C) f and (D) D*; quantitative DCE MR perfusion maps, (E) Ktrans, (F) Kep, (G) Ve and (H) Vp.
