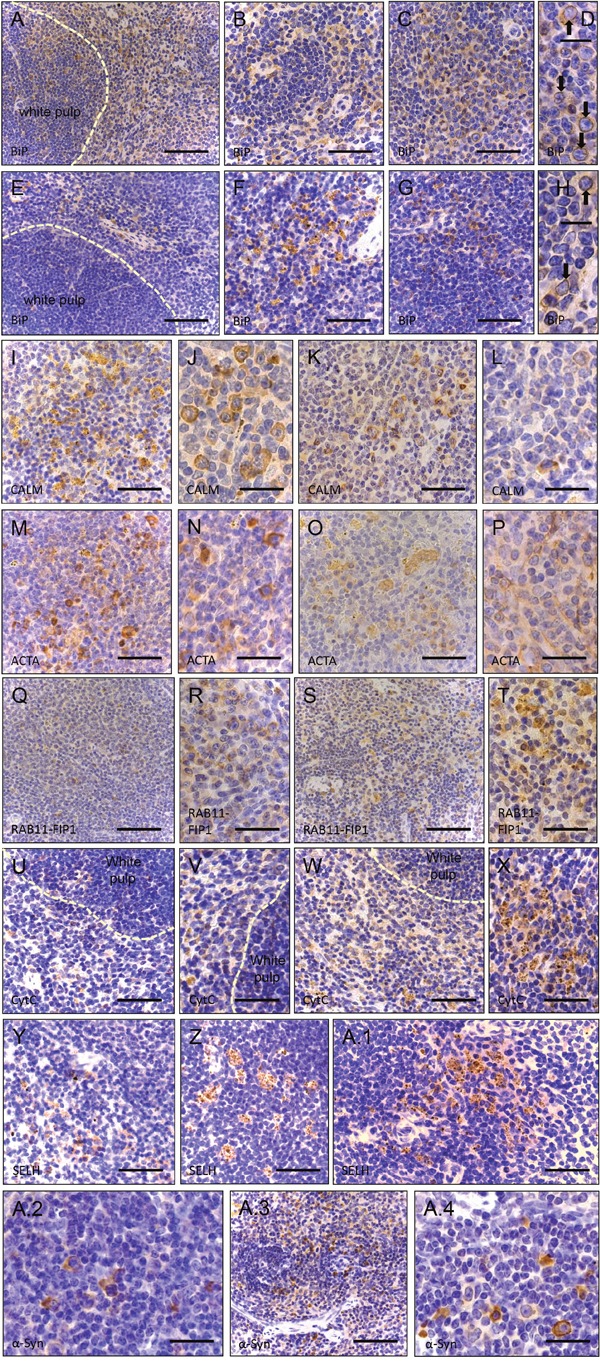
Figure 5. Immunohistochemistry of paraffin sections of paraformaldehyde-fixed spleen specimens of 26-week old control (wt) and of Sil1 mutant mice.

(A-D) BiP immunoreactivity of the ER and of the nuclear envelope (black arrows in D) in wt animals. Scale bars A = 100 μm; in B, C = 110 μm; in D = 50 μm (B-D = red pulp). Whereas overall BiP immunoreactivity of the ER is reduced in Sil1 deficient animals, focal enrichment of BiP within the nuclear envelope (black arrows in H) is similar to the control animals. Scale bars E = 100 μm; in F, G = 110 μm; in H = 50 μm (E-H = red pulp). Calmodulin (CALM) immunoreactivity of the red pulp in wild-type animals (I-J) and reduced immunoreactivity of the red pulp in Sil1 mutant animals (K, L). Scale bars in I, K = 110 μm; in J, L = 75 μm. Cells of white and red pulp show stronger actin (ACTA) immunoreactivity in wt (M, N) than in Sil1 mutant animals (O, P). Scale bars in M, O = 110 μm; in N, P = 75 μm. (Q, R) Less intense RAB11-FIP1 immunoreactive structures in the red pulp of wt animals compared to in Sil1 mutant animals (S, T). Scale bars in Q, S = 100 μm; in R, T = 140 μm. (U, V) Cytochrome C (CytC) reduction in wt animals compared to Sil1 mutant littermates (W, X). Scale bars in U, W = 110 μm; in V, X = 140 μm. Analogous reduction of Selenoprotein H (SELH) immunoreactivity in wt (Y) in comparison to SIL1 deficient splenic cells (Z, A.1). Scale bar in Y = 100 μm; in Z, A.1 = 110 μm. α-synuclein (α-Syn) staining is less prominent in wt splenic cells (A.2) compared to cells in Sil1 mutant mice (A.3, A.4). Scale bars in A.2, A.4 = 75 μm; in A.3 = 150 μm.
