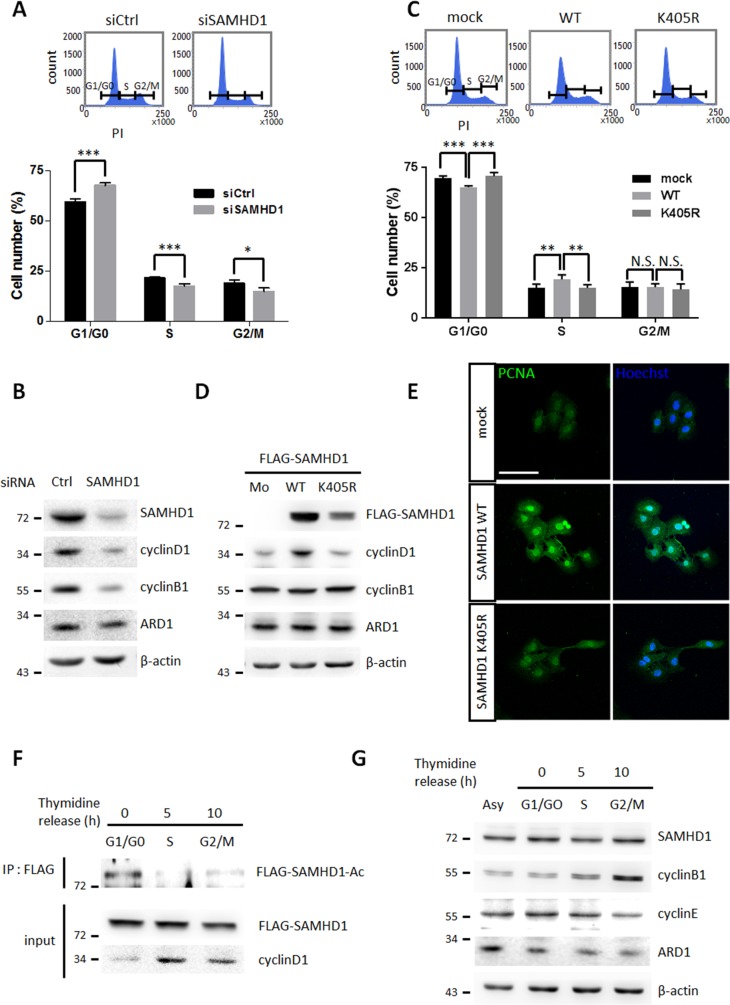
Figure 5. SAMHD1 acetylation promotes G1/G0 transition in cancer cells.
(A) Cell cycle profiles of siCtrl or siSAMHD1 treated HeLa cells were determined by flow cytometry. Representative cell cycle profiles (top); the percentage of cells in each phase is presented as mean ±S.D. (n=3) (bottom). (B) Lysates were extracted from siCtrl or siSAMHD1 treated HeLa cells and the levels of cyclin D1 and cyclin B1 were immunoblotted by corresponding antibodies. (C) Cell cycle profiles of stable A549 cells expressing SAMHD1 wildtype, K405R or empty vector were determined by flow cytometry. Representative cell cycle profiles (top); the percentage of cells in each phase is presented as mean ±S.D. (n=3) (bottom). (D) The levels of cyclin D1 and cyclin B1 were immunoblotted in the lysates extracted from stable A549 cells expressing SAMHD1 wildtype, K405R or empty vector. (E) Stable Hep3B cells expressing SAMHD1 wildtype, K405R or empty vector were serum-deprived for 48 h and were re-stimulated for 24 h, then the expressions of PCNA were monitored by confocal microscopy with immunofluorescence using the PCNA antibody. Hoechst was used for nuclei staining. Scale bar; 100 μm. (F) FLAG-SAMHD1 wildtype expressing stable A549 cells were synchronized to specific cell cycle phases using thymidine-double block method. SAMHD1 was precipitated and blotted with an anti-Lys-Ac antibody. (G) HeLa cells were synchronized to specific cell cycle phases by thymidine double block method. The expression levels of SAMHD1 was assessed by western blotting. *P<0.05; **P<0.01; ***P<0.001; t test; N.S.; not significant; Asy; asynchonized.

