
Figure 3. Colour map representation of gefitinib-induced tyrosine phophorylation inhibition in peptide profiles obtained with the combined 37 patients described in Figures 1 and 2.
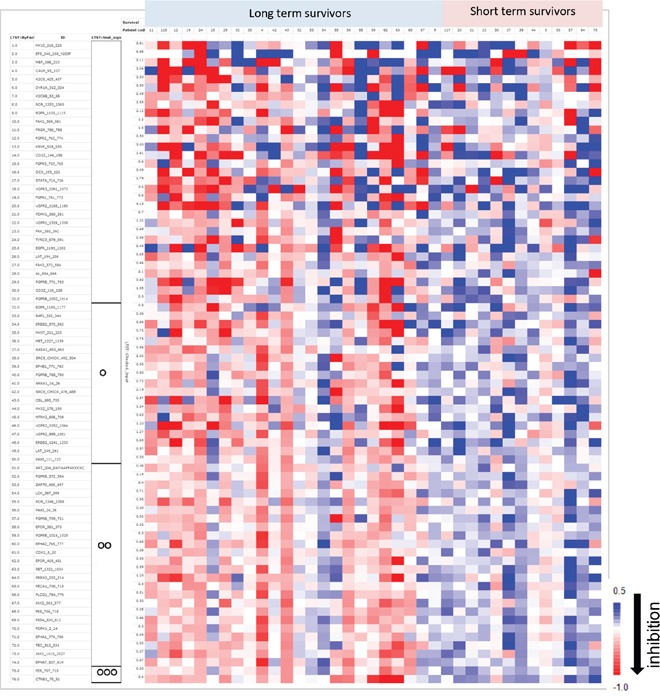
Patient samples are sorted in columns according to their survival status. Rows represent the peptides sorted according to their correlation with survival status. As depicted in the colour bar scale, a red colour indicates a relatively high “inhScor” value, a Log2-transformed ratio of tyrosine phosphorylation inhibition by gefitinib. The significance obtained in the t test per peptide is indicated on the left side of the figure using the following coding: OOO, p < 0.001; OO, p < 0.01; O, p < 0.05; p ≥ 0.05 otherwise.