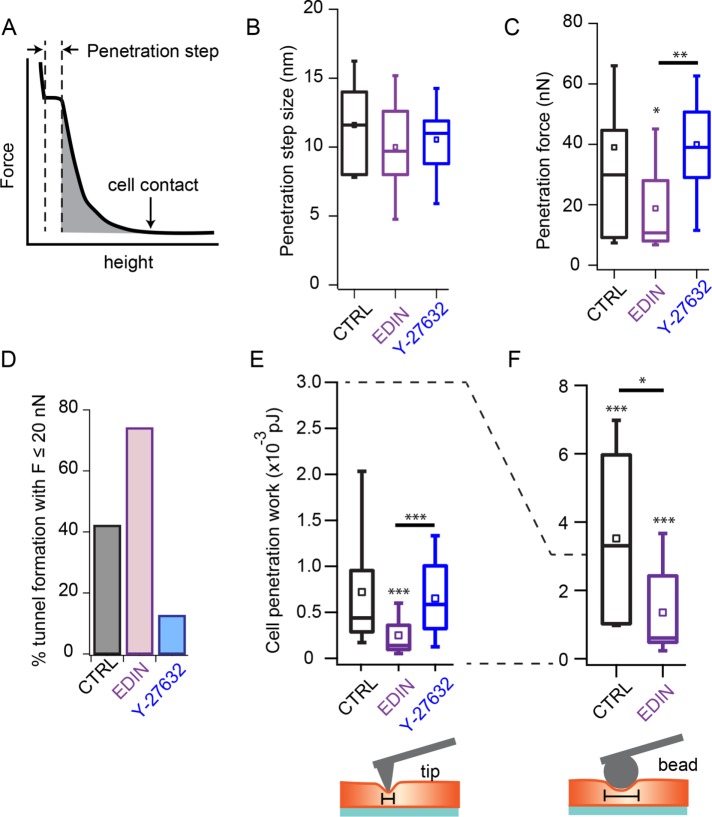
FIGURE 3:
Altered cell mechanics by EDIN decreases the barrier against tunnel opening. (A) Cartoon plot of force-vs.-height curve. The point of tip-cell contact is indicated by an arrow. The penetration step size during tunnel opening is measured as shown on the cartoon. Penetration work is measured by computing the shaded area under the curve. Area is computed from the cell contact point until right before cell penetration occurs. (B) Penetration step sizes for control, EDIN-expressing and Y-27632–treated cells. Box plots show the median and the 25th and 75th percentiles of distribution. Open squares show mean thickness. No difference observed among the three conditions. NCTRL = 32, NEDIN = 27, NY-27632 = 12. (C) Force required to induce tunnels for the three conditions. On average, the penetration force for cells expressing EDIN was lower than for control cells. NCTRL = 38, NEDIN = 27, NY-27632 = 16. (D) Percentage of indentation experiments that induced tunnels at forces equal to or below 20 nN. A larger fraction of EDIN-expressing, but not ROCK-inhibited, cells formed tunnels at lower forces compared with control cells. (E) Work done to fully indent the cell and form a tunnel. Cells expressing EDIN required less work than control and Y-27632–treated cells to induce tunnels. NCTRL = 34, NEDIN = 27, NY-27632 = 16. (F) To evaluate the contribution of actomyosin network density on the barrier against tunnel formation, the indentation experiments were repeated using a 5.66 µm bead glued to the end of a tipless cantilever, which increases the surface area of indentation. The tunnel barrier was increased with the use of a bead to indent cells for both control and EDIN conditions. Control cells showed a larger fold increase in penetration work compared with EDIN-expressing cells. NCTRL = 7, NEDIN = 9. Statistical analyses were performed using the nonparametric Wilcoxon rank sum test. Statistical significance of distribution differences between EDIN or ROCK inhibition data and control data are noted above the box. The horizontal bars show comparison between EDIN and ROCK inhibition conditions. *p < 0.05, **p < 0.01, ***p < 0.001.

