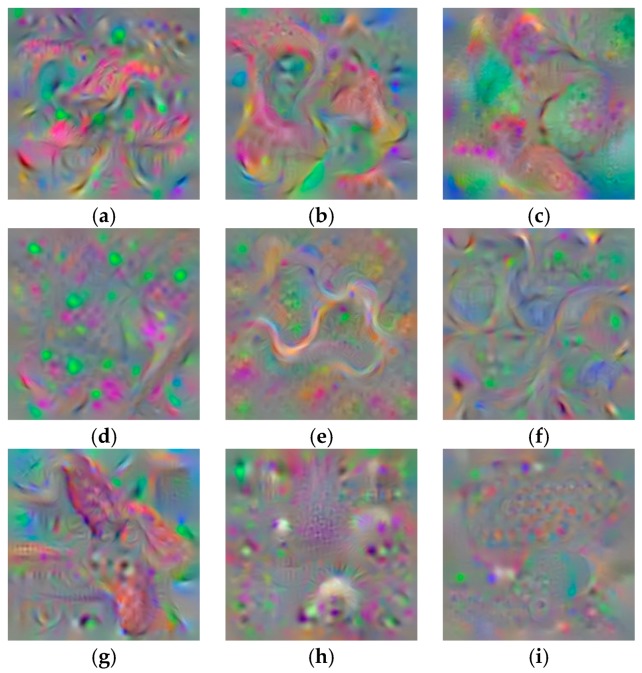
Figure 7.
Deep feature maps visualization of diseases and pest (a) Canker; (b) Gray mold; (c) Leaf mold; (d) Low temperature; (e) Miner; (f) Nutritional excess; (g) Plague; (h) Powdery mildew; (i) Whitefly. Each feature map illustrates how our neural network system interprets a disease in the context after being classified by a SoftMax function.

