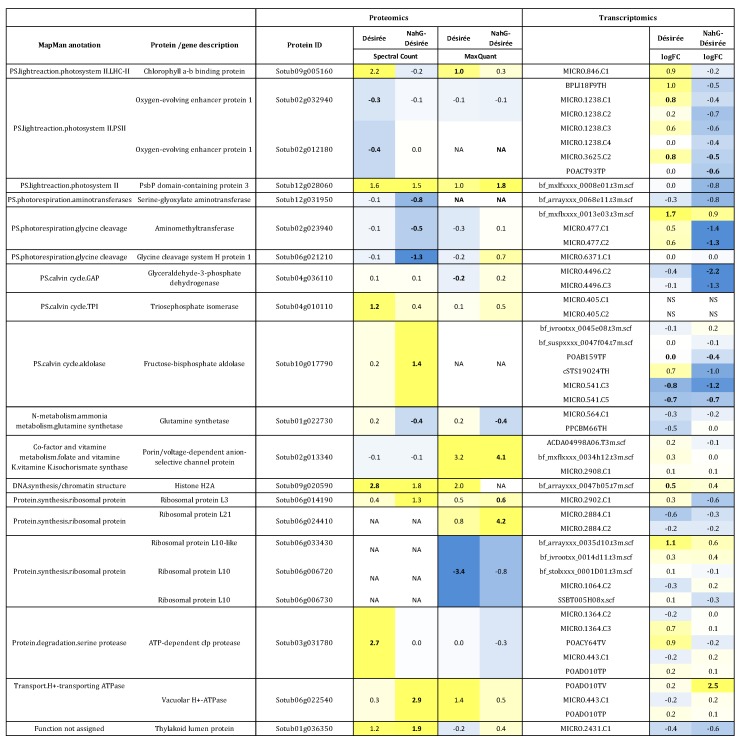
Figure 1.
Summary of the differentially abundant proteins in leaves of Désirée and NahG-Désirée plants after infection with PVY and comparison to mRNA expression data. Proteins are grouped according to their function and for each protein the best hit(s) identified according to complete set of available potato sequences are given. Figure shows average ratio (log2FC) of the protein abundance or corresponding gene expression (infected versus mock-treated) at 4 dpi. Results for two genotypes are shown (Desiree and NahG-Désirée). As different POCI sequences can represent the same gene, allelic variant or closely related gene family multiple hits were often retrieved per one protein in this database. Proteins are thus linked to multiple results of microarray analysis. Results are color-coded: yellow-up regulation, blue down regulation. NS-not significant, NA-not available (proteins that were not identified). Statistically significant differences (FDR corrected p < 0.05) are in bold. PVY = potato virus Y; POCI = Potato Oligo Chip Initiative; FDR = false discovery rate.

