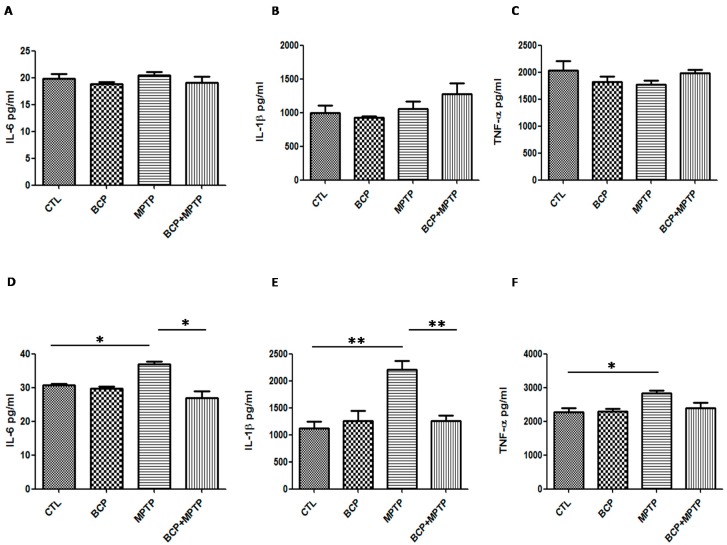
Figure 10.
Protein levels of inflammatory cytokines in the nigrostriatal system. Graphsshowing the mean ± SEM of three individual experiments of the protein levels of IL-6, IL-1β, andTNF-α in the striatum (A–C) and the substantia nigra (D–F) determined using the indirect ELISA method. IL-6: * p < 0.05, CTL vs. MPTP treatment. * p < 0.05, MPTP treatment vs. BCP + MPTP treatment. IL-1β: ** p < 0.01, CTL vs. MPTP treatment. ** p < 0.01, MPTP treatment vs. BCP + MPTP treatment. TNF-α: * p < 0.05, CTL vs. MPTP treatment.

