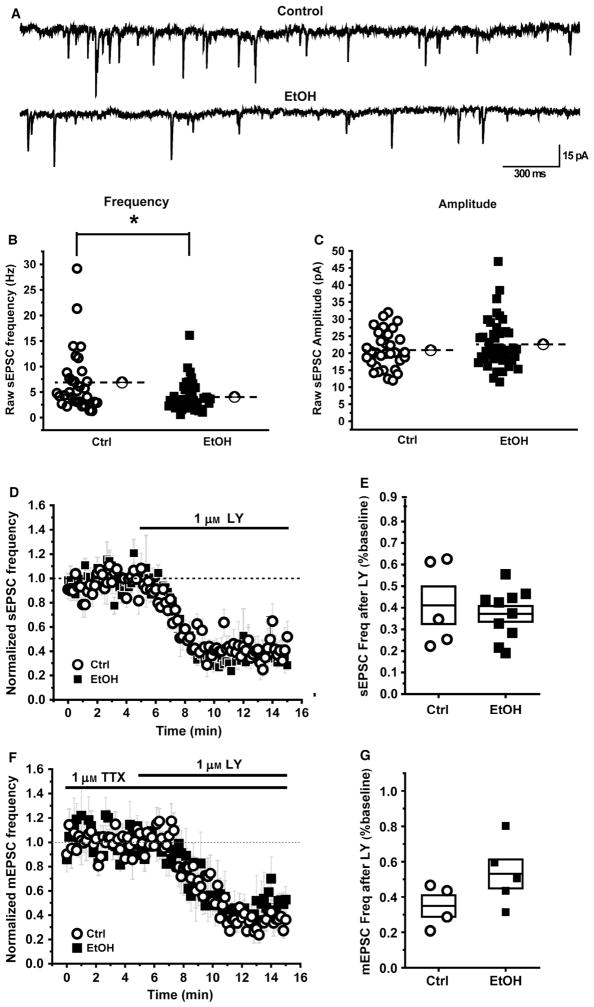
Fig. 3.
Decrease in spontaneous glutamatergic transmission in the NAc of rats following 24 h withdrawal from 7 weeks of alcohol consumption. (A) Example sEPSC traces from control (Ctrl) and alcohol-consuming (EtOH) rats. (B, C) Summary data for all the cells recorded from in both the groups. Open circles represent cells from control rats (n = 32 cells) and filled squares represent cells from alcohol-consuming rats (n = 44 cells). There is a modest but statistically significant decrease in sEPSC frequency in alcohol-consuming rats compared to the controls (B) without any change in sEPSC amplitude (C). Dotted lines represent the population mean. (D, E) The mGlur2/3 agonist LY379268 equally decreases the sEPSC frequency in both groups. (D) sEPSC frequency decreases following bath application of 1 μM LY at 5 min. The raw data was normalized to baseline period (2–5 min). (E) Box plots summarizing the effects of LY on sEPSC frequency in cells recorded from control and alcohol-consuming rats. Note that no additional inhibition of sEPSCs was observed at 10 μM LY (n = 5 cells, data not illustrated). (F, G) LY equally decreases mEPSC frequency in both groups. Recordings were made in the presence of 1 μM TTX to isolate mEPSC and 1 μM LY was bath applied at 5 min. (F) mEPSC frequency was decreased in both the groups by LY. The raw data were normalized to baseline period (2–5 min). (G) Box plots summarizing the effects of LY on mEPSC frequency in cells recorded from alcohol-consuming and control rats. In panels E and G, the horizontal line within the box indicates the mean and the top and bottom edges represent the mean ± the SEM. * indicates significant difference between groups (P < 0.05).

