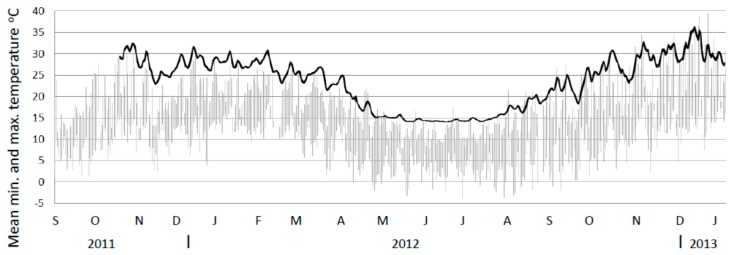
Figure 5.
Internal temperature profile of untreated mounds (mean minimum to maximum range) for untreated mounds (n = 9 up till January 2012 and n = 10 thereafter) from November 2011 to January 2013 (black line). Note. Mound minimum and maximum temperatures are so close they appear as a single line. Ambient temperature ranges from the closest weather station shown in grey. Note. Temperature probes had a lower limit of 14.5 °C.

