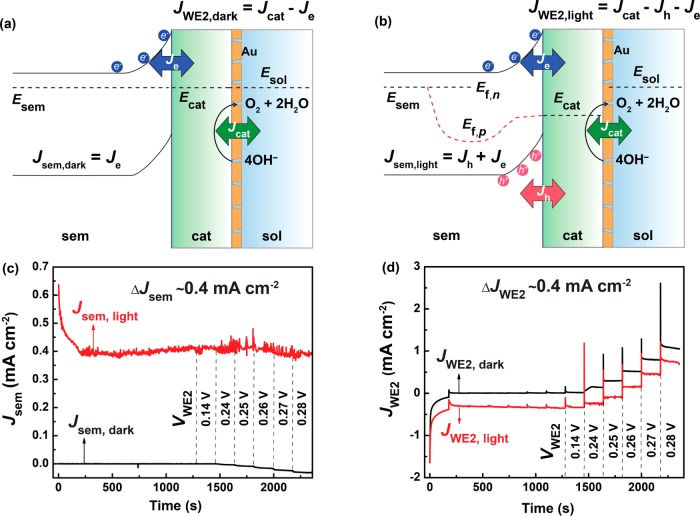
Figure 4.
Photogenerated hole transfer at the interface of α-Fe2O3|Ni0.8Fe0.2Ox. (a) Band bending schematic of the interface in the dark. (b) Band bending schematic of the interface under illumination. (c) Current densities of α-Fe2O3 when WE1 is held at 0 V vs εo2/OH– both in the dark (black curve) and under illumination (red curve) while controlling the potentials of the catalyst in a chronoamperometry experiment. (d) Current densities measured from WE2 under different Vcat vs εo2/OH– with Vsem held at 0 V vs εo2/OH– in the dark (black curve) and under illumination (red curve). Because WE2 holds the potential of the catalyst at fixed values, any photoexcited holes injected from the semiconductor must be collected at WE2—otherwise the catalyst potential would change.

