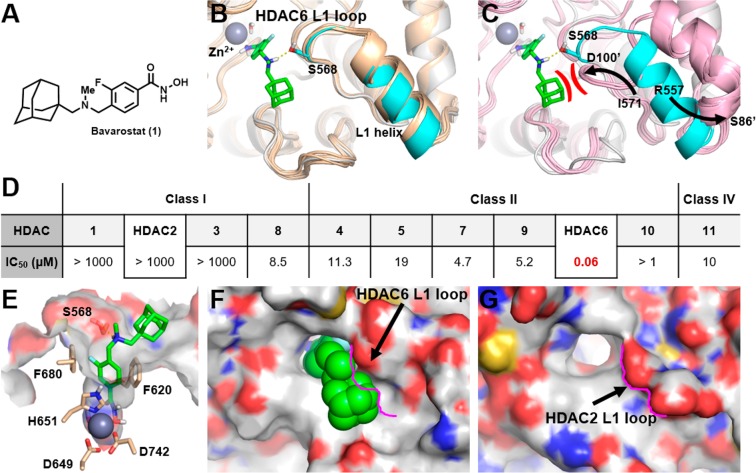
Figure 1.
A: Structure of Bavarostat (1). B: Alignment of hHDAC6’s catalytic domain 2 (CD2) (white and cyan protein, PDB 5EDU) and the 15 zHDAC6 CD2 crystal structures available in the PDB database (wheat colored proteins), showing similar L1 loop and L1 helix conformations. HDAC6-selective inhibitor Bavarostat was docked into the hHDAC6 complex described in the Experimental Section. Bavarostat is predicted to form a hydrogen bond (yellow dashed line) with Ser568 on the hHDAC6 L1 loop segment represented in cyan. C: Alignment of hHDAC6 CD2 (white and cyan) and the five hHDAC2 catalytic site crystal structures (pink proteins) in PDB. Large movement of both the L1 loop segment and the L1 helix is represented by arrows (arrows depict movement of analogous amino acids from hHDAC6 to hHDAC2: left arrow depicts hHDAC6’s Ile571 going to corresponding hHDAC2’s Asp100′, and right arrow depicts hHDAC6’s Arg557 going to corresponding hHDAC2’s Ser86′). Prime indicates hHDAC2. The hypothesized steric and electrostatic clash between Bavarostat and the hHDAC2 L1 loop is represented in red. D: IC50 values for Bavarostat inhibition of HDAC1–11 were determined in a fluorescence assay (BPS Bioscience, San Diego, CA) measuring acetylation of a synthetic substrate. E: Bavarostat docked into a hHDAC6 CD2 complex incorporating a conserved water. Key amino acids chelating the catalytic zinc or lining the 10 Å channel are labeled. F/G: Significant topography differences between the surface of the catalytic domains of hHDAC6 (F) and hHDAC2 (G) are highlighted by the pink contouring of the L1 loop segment of hHDAC2.

