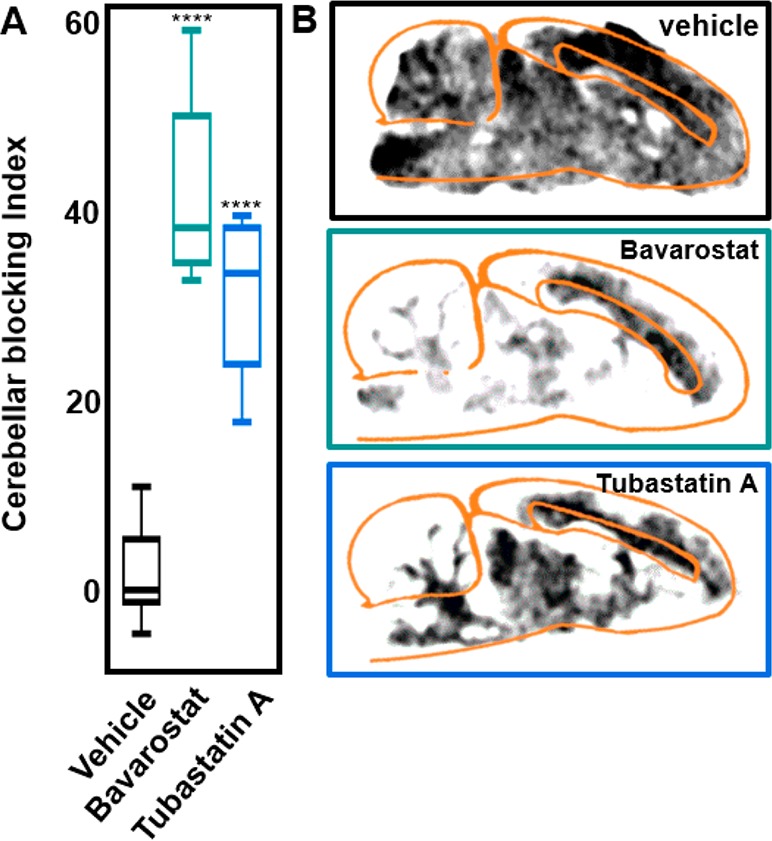
Figure 4.

Autoradiography with [18F]Bavarostat. A: Signal intensity of cerebellum relative to corpus callosum at baseline and in sagittal slices of Sprague–Dawley rat brain pretreated with 10 μM Bavarostat or Tubastatin A respectively. Blocking index = 1 – [(PTCB·PTCC–1)/(BLCB·BLCC–1)], PT = pretreated, BL = vehicle treatment, CB = cerebellum, CC = corpus callosum. ****P < 0.0001. B: Representative sagittal slices of Sprague–Dawley rat brains pretreated with vehicle, 10 μM Bavarostat, or Tubastatin A respectively.
